
SPY Weekly Blueprint: Reclaiming Record Highs at $776.85 & Navigating the Leo Solar Eclipse Energy
Executive Overview: The Big Picture
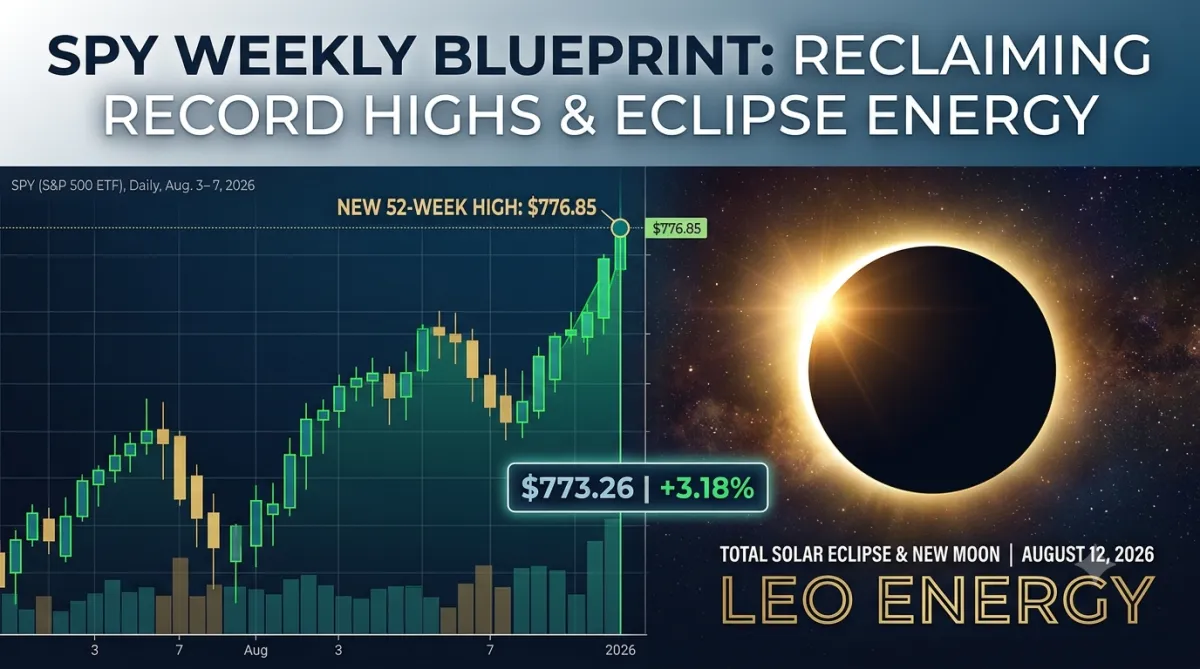
The week of August 3 through August 7, 2026, delivered a strong bullish expansion for the S&P 500 ETF (SPY). Emerging from a multi-week consolidation range around $730–$747 in late July, SPY launched into high-volume displacement early in the week, topping out at a new 52-week high of $776.85 on Wednesday before settling into a bullish consolidation and closing strong at $773.26 on Friday.
Weekly Open: $749.44 | Weekly High: $776.85 (52-Wk High)
Weekly Low: $748.80 | Weekly Close: $773.26 (+3.18% / +$23.80)
Weekly Candlestick Structure: A wide-range bullish expansion candle featuring a tiny lower wick, strong body closure near the top of the range, and a brief upper wick resulting from profit-taking at all-time highs.

Day-by-Day Price Action Breakdown (Aug 3 – Aug 7, 2026)
Monday, August 3, 2026: The Initial Displacement
OHLC: Open: $749.44 | High: $758.58 | Low: $748.80 | Close: $757.67 (+1.42%)
Candlestick Pattern: Bullish Marubozu / Expansion Candle.
ICT Concepts:
Bullish Order Block (OB): The session opened near the low of $748.80, sweeping sell-side liquidity before institutional buyers stepped in. This $748.80–$750.00 level now stands as a high-timeframe Bullish Order Block.
Displacement: Strong buying pressure pushed price straight through previous resistance with zero meaningful pullbacks.
Tuesday, August 4, 2026: The Breakout Gap & Go
OHLC: Open: $760.63 | High: $773.41 | Low: $760.52 | Close: $771.33 (+1.80%)
Candlestick Pattern: Massive Bullish Continuation Candle.
ICT Concepts:
Fair Value Gap (FVG): The gap up created a daily Fair Value Gap between Monday’s high ($758.58) and Tuesday’s low ($760.52). This $758–$760 range is now a key institutional discount zone.
Liquidity Run: Price aggressively ran buy-side liquidity, pushing past $770 without hesitation.
Wednesday, August 5, 2026: 52-Week High Sweep & Rejection
OHLC: Open: $775.85 | High: $776.85 | Low: $769.51 | Close: $769.79 (-0.20%)
Candlestick Pattern: Inverted Hammer / Shooting Star (Topping Tail).
ICT Concepts:
Liquidity Sweep: Price opened high and spiked to $776.85 (a fresh 52-week high), sweeping retail stop-losses and buy-side liquidity above existing highs before aggressively reversing.
Bearish Supply Zone / Order Block: The rejection tail between $775.85 and $776.85 established a daily premium supply zone.
Thursday, August 6, 2026: Consolidation in the Discount
OHLC: Open: $770.21 | High: $771.82 | Low: $767.46 | Close: $768.56 (-0.16%)
Candlestick Pattern: Inside Bar / Spinning Top (Consolidation).
ICT Concepts:
Internal Liquidity Build: Price pulled back to test $767.46, absorbing Wednesday's post-sweep selling without reaching down into the deeper $760 FVG. This formed an internal equilibrium range.
Friday, August 7, 2026: Bullish Re-Expansion
OHLC: Open: $771.02 | High: $773.91 | Low: $769.61 | Close: $773.26 (+0.61%)
Candlestick Pattern: Bullish Hammer / Re-expansion Candle.
ICT Concepts:
Higher Low Formation: Sellers tried to push price down to $769.61, but buyers defended the structure.
Premium Closure: Price rallied back into the upper end of the weekly range, closing near the daily high at $773.26, indicating sustained institutional interest heading into next week.
Weekly Summary Matrix
Technical Outlook & Prediction (Aug 10 – Aug 14, 2026)
 [ $780.00 Target Zone ] ▲ │ [ $776.85 52-Wk High Sweep ] ▲ │
───► Current Price: $773.26 ◄─── │ [ $767.46 Support Pivot ] │ ▼ [ $758.58 - $760.52 FVG Support Zone ]
Primary Bullish Outlook:
With Friday closing near $773.26, the underlying market structure remains firmly bullish.
Target 1: A retest of the $776.85 52-week high.
Target 2: If price breaks above $776.85 with volume, expect momentum to target the $780.00 psychological round-number level.
Secondary Retracement Outlook:
If SPY loses Thursday's low at $767.46, expect a deeper pullback into the $758.58–$760.52 Fair Value Gap.
Look for bullish order flow confirmation in that discount gap for high-probability long re-entries.

Cosmic Trading Guide: Moon Phases & Energy Focus (Aug 10 – Aug 14, 2026)
For traders who track lunar alignments and macro sentiment timing, this week holds a rare celestial catalyst: A Total Solar Eclipse coinciding with the New Moon on Wednesday, August 12.
Monday, August 10, 2026
Moon Phase: Waning Crescent (Balsamic Moon)
Energy Focus: Restoration & Preparation
Trader Strategy: The final stage of the waning moon brings low energy and reflection. Avoid forcing early entries; focus on mapping key weekly levels and clearing mental fatigue from last week's rally.
Tuesday, August 11, 2026
Moon Phase: Waning Crescent (Final Dark Moon)
Energy Focus: Patience & Clearing Biases
Trader Strategy: The dark moon phase often brings quiet accumulation or deceptive intraday sweeps before big market moves. Keep position sizes conservative and remain flexible.
Wednesday, August 12, 2026
Moon Phase: New Moon & Total Solar Eclipse in Leo (17:36 UTC / 1:36 PM EDT)
Energy Focus: High Transformation & Volatility Reset
Trader Strategy: Solar Eclipses represent rapid shifts in momentum, temporary blind spots, and institutional structural resets. Mid-day price action around 1:30 PM EDT could bring heightened volatility or sharp reversals. Prioritize strict risk control over FOMO.
Thursday, August 13, 2026
Moon Phase: Early Waxing Crescent (Post-Eclipse Shift)
Energy Focus: Planting Seeds & Structural Clarity
Trader Strategy: As the light begins to return, post-eclipse market intention usually becomes visible. Execute new swing or day trades with high-confluence setups as genuine trends take hold.
Friday, August 14, 2026
Moon Phase: Waxing Crescent
Energy Focus: Building Momentum & Execution Confidence
Trader Strategy: Early momentum builds under the waxing crescent. Align intraday trades with confirmed weekly order flow and lock in gains prior to the weekend.
