
SPY Price Action Report Aug 10–14, 2026 | Fair Value Gaps, Order Blocks & Moon Energy
Welcome Back to the Crib
No RSI. No MACD. No moving averages stacked on top of each other like alphabet soup. Just price, structure, and the story candles tell when you actually sit with them — plus the lunar backdrop that was quietly moving through a New Moon Total Solar Eclipse this exact week. That's the lens for this report.
We're breaking down SPY (SPDR S&P 500 ETF Trust) from Monday, August 10 through Friday, August 14, 2026, purely through fair value gaps (FVGs), order blocks (OBs), liquidity, and candlestick behavior across the weekly, daily, and 2-hour timeframes, with the 15-minute chart used the way you use it — as a final confirmation before you click the button. Then we'll close with the levels to watch for August 17–21, and align it all with the moon's phase, sign, and energy for the week ahead.
Let's get into it...
The Higher-Timeframe Anchor: What the Weekly Chart Was Telling Us
Before zooming into the daily grind, smart money traders always start at the top of the timeframe hierarchy. Here's where SPY sat on the weekly chart heading into August 10:
Prior week close (Aug 7): 773.26 — the third consecutive weekly gain, capping off an explosive run off the late-July base.
Untouched weekly-scale demand: The rally off the July 20–24 pullback (roughly the 737–749 zone, anchored by the July 24 low of 737.29 and the July 20 high of 748.73) still stands as the higher-timeframe bullish order block underpinning this entire leg. Price hasn't looked back at it once.
A massive unmitigated daily FVG was left behind between 748.90 and 760.52 — the gap torn open during the July 31 → August 4 launch. That imbalance is still sitting open beneath current price like an unpaid toll. It won't matter until it does, but it's the level bulls do not want to see revisited on a weekly closing basis.
Going into the week of August 10, SPY was pressing into the 771.66–774.25 supply band that had already rejected price once in early August — the "ceiling" this entire week would be forced to negotiate with.
Daily Breakdown: Monday, August 10 – Friday, August 14, 2026
Monday, August 10 — Testing the Ceiling
SPY opened at 772.60 and pushed into 775.05 intraday, tagging the lower edge of the supply zone that had already capped rallies the week before. The candle closed at just 773.03 — a small-bodied candle with a disproportionate upper wick, essentially a rejection print at resistance without enough conviction to call it a full reversal signal yet. On the 2H chart, this played out as two clean impulse legs up into London/NY overlap that both stalled at the same ceiling, leaving a thin, unfilled 2H bearish imbalance just under the 775 handle. No fresh daily FVG was created here — Monday was pure range compression against known supply, the kind of day where patience, not entries, is the edge.
Order block note: Monday's full range (771.62–775.05) is the candle that mattered most in hindsight — not because of what it did, but because of what it set up for Tuesday.
Tuesday, August 11 — The Liquidity Sweep
This was the sell-off day. Price opened at 774.53 — right inside Monday's range — and immediately rejected, printing a near-marubozu bearish candle with only an 8-cent upper wick, closing at 770.56 after tagging a low of 769.20. That decline swept the sell-side liquidity resting below Monday's low (771.62) and drove into — but did not fully clear — the deeper liquidity pool sitting under the prior week's swing low near 767.46.
Because Tuesday's aggressive decline originated from within Monday's candle range, Monday's 771.62–775.05 zone is confirmed as a bearish order block — the last up-close consolidation before a violent expansion down. On the 2H chart, the sell-off structured as a clean displacement leg through the London session that left a bearish 2H FVG behind it; the 15-minute chart showed the kind of one-directional stair-step (lower highs, no meaningful retracement) that no-indicator traders live for — confirmation that the move had commitment, not chop.
Wednesday, August 12 — The Eclipse Pause
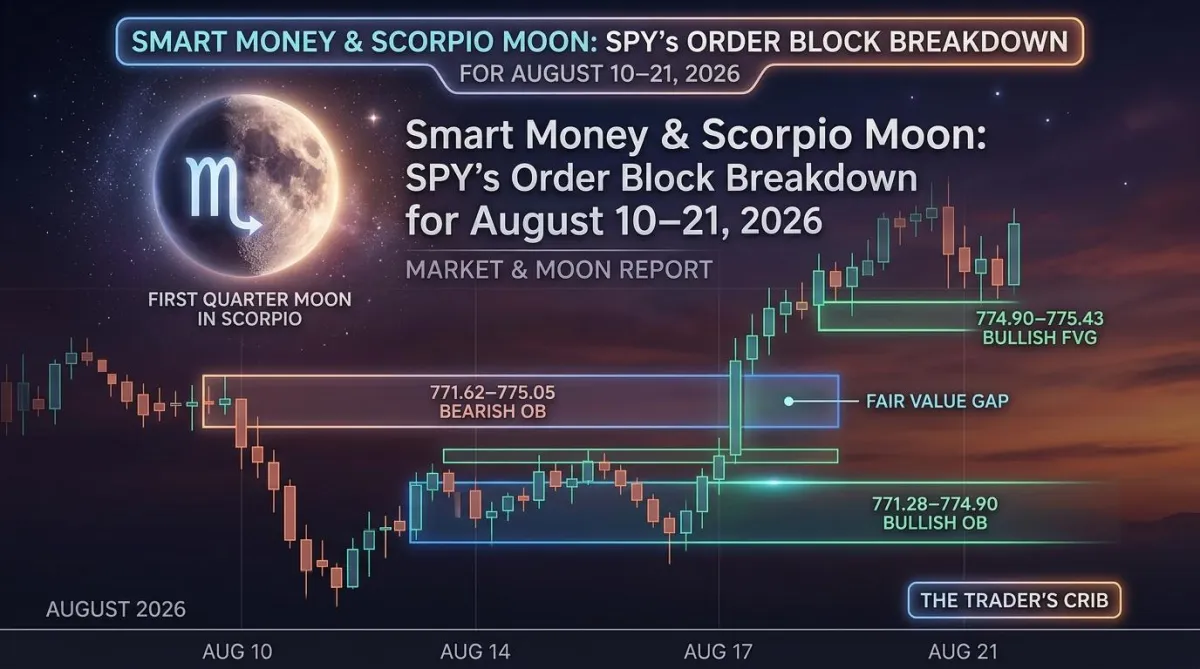
Fittingly, this was the date of August's rare New Moon Total Solar Eclipse — and the chart matched the energy. Wednesday opened at 774.71, tagged a marginal new high at 774.90, then drifted lower to close at 772.49. On its own it reads as a soft bearish candle, but structurally, the entire session traded inside Tuesday's much larger range — a harami-style pause candle, indecision after a strong directional day. The lower wick (low of 771.28, close of 772.49) shows buyers stepping in and defending the zone rather than letting the sell-off continue unchecked.
This is the candle that matters most for what came next: because Thursday's rally would launch from within this exact range, Wednesday's 771.28–774.90 zone is the bullish order block for the week's breakout. On the 2H chart it showed up as basing/consolidation candles with shrinking range — classic pre-expansion compression, the market coiling before it moves. If you were only watching the 15-minute chart, Wednesday looked like nothing was happening. That's exactly the point — the eclipse window is historically a "reset" moment, and price mirrored it by going quiet before its next real move.
Thursday, August 13 — Displacement Day
This was the week's signature candle. SPY opened at 774.87 — inside Wednesday's order block — and expanded aggressively to a high of 779.37 before closing at 777.88, a full-bodied bullish displacement candle that broke clean through the entire Monday–Wednesday range. This single candle did two important things structurally:
It mitigated and confirmed Wednesday's bullish order block as valid support.
It created a fresh daily bullish fair value gap between 774.90 (Wednesday's high) and 775.43 (Friday's low) — a real, textbook three-candle imbalance that price had not filled by week's end.
On the 2H chart, Thursday's move structured in two impulse legs separated by a brief NY-lunch consolidation, each leaving its own smaller 2H FVG in the 776–778 region. The 15-minute chart offered the clean, no-indicator confirmation: strong-bodied green candles with minimal upper wicks all the way into the close — no hesitation, no rejection, just acceptance of higher prices.
Friday, August 14 — Profit-Taking Into the Gap
Friday opened at 778.54, just above Thursday's close, then drifted down to 775.43 — landing precisely on the bottom edge of Thursday's freshly created daily FVG — before recovering to close at 776.34. This is a textbook corrective pullback candle: it opened above the prior close, tapped an unmitigated imbalance, and closed red but still comfortably inside Thursday's range rather than breaking it. On the 2H chart, the retracement into the FVG was a controlled pullback (not an impulsive reversal), and the candle that formed at the 775.43 low showed a small lower-wick rejection — the market respecting its own imbalance rather than plowing through it. That's confirmation, not concern.

Weekly Summary: What the Week Actually Told Us
Zooming back out to the weekly candle: SPY opened the week at 772.60, swept liquidity down to 769.20 on Tuesday, and closed at 776.34 on Friday — a bullish weekly candle with a lower wick, the market's fourth consecutive up week. Structurally:
Bearish order block (771.62–775.05, formed Monday) was tested and respected on Tuesday's open before the sweep.
Bullish order block (771.28–774.90, formed Wednesday) launched Thursday's breakout and now stands as the level to watch on any pullback.
Fresh daily bullish FVG (774.90–775.43) was created Thursday and partially tested Friday — still technically open and worth watching for a full mitigation tap.
Deep, still-unfilled daily FVG (748.90–760.52) remains the higher-timeframe magnet if this rally ever truly runs out of road.
Liquidity resting below 767.46 (prior week's low) was approached but never swept — it's still sitting there.
In plain terms: the week was a higher-low, higher-high continuation — a pullback into a defended order block, followed by displacement to new weekly highs, followed by a controlled retest of the gap it left behind. That is about as clean as smart-money structure gets.
The Week Ahead: SPY Outlook for August 17–21, 2026
With no indicators — just structure — here's the framework for the coming week:
Bullish continuation scenario: As long as SPY holds above the Wednesday order block (771.28–774.90) on daily closes, and especially if the 774.90–775.43 FVG holds as support on any retest, the path of least resistance stays up, with the next liquidity draw sitting toward the untested highs above 779.37 and a potential run at the 780.00 level that's been acting as the market's stated "band ceiling" for the past two weeks.
Bearish/correction scenario: A daily close back below 774.90 opens the door to a deeper retest of the Wednesday order block low (771.28) and, if that fails, the liquidity resting near 767.46 becomes the next realistic draw — with the much larger 748.90–760.52 FVG the eventual (lower-probability, longer-timeline) magnet if broader risk sentiment shifts.
What to watch on the 2H and 15-min charts this week: Look for how price reacts the first time it revisits the 774.90–775.43 FVG and the 771–775 order block zone. A clean rejection with displacement (like Thursday's candle) confirms continuation; a slow grind through with no reaction confirms the level is failing. Let the reaction — not a prediction — do the talking.
(As always: this is price-action framework, not financial advice. Markets are probabilistic, not predictable — trade your plan, size your risk, and let the chart confirm before you commit capital.)

Moon Phases, Signs & Energy: August 17–21, 2026
This is where The Trader's Crib becomes more than a chart room. The market doesn't move in a vacuum, and neither do you. Here's the lunar weather for the week ahead — use it to understand your own energy, not to time entries.
Monday, August 17 — Waxing Crescent Moon in Libra
The moon is about 31% illuminated and sitting in Libra, a sign of balance, fairness, and partnership. This is a day for weighing risk against reward with a clear head — good energy for reviewing your trading plan, journaling last week's wins and mistakes, and making sure your positions are actually balanced rather than emotionally lopsided. Libra doesn't like extremes. If you're overexposed on one side of the market, Monday's energy is nudging you to notice it.
Tuesday, August 18 — Waxing Crescent Moon, Libra shifting into Scorpio
The moon spends part of the day finishing its pass through Libra before crossing into Scorpio by evening. You may feel the shift — Libra's need for balance giving way to Scorpio's pull toward depth and intensity. This is a good transition day to move from planning into conviction. Trust the process you built on Monday.
Wednesday, August 19 — First Quarter Moon in Scorpio (exact 10:46 PM EDT)
This is the most charged day of the week, astrologically. The First Quarter Moon is a classic tension point in the lunar cycle — the moon squares the sun, creating a natural friction that demands action. In Scorpio, a sign that rules shared resources, debt, investment, and transformation, this energy is almost uncannily on-theme for a trading blog. First Quarter Moons ask you to do something with the intentions you set at the New Moon (which, notably, was also a rare Total Solar Eclipse just five days earlier, on August 12 — right in the middle of last week's price action). Expect this day to feel more emotionally charged or decisive than the others. Channel it into disciplined execution, not impulsive revenge trading. Scorpio energy rewards patience and precision, not force.
Thursday, August 20 — Waxing Gibbous Moon, Scorpio shifting into Sagittarius
Just past the First Quarter, the moon is now waxing gibbous and beginning its move into Sagittarius — a sign of expansion, optimism, and big-picture thinking. Energetically, this is a natural day to widen your lens: if Scorpio had you narrowly focused on one setup, Sagittarius invites you to zoom out and reconnect with your bigger trading vision and goals.
Friday, August 21 — Waxing Gibbous Moon in Sagittarius
The moon is now fully in Sagittarius, building toward the Full "Sturgeon" Moon and partial lunar eclipse coming on August 28. Sagittarius energy is bold, forward-looking, and growth-oriented — a good note to end the week on. Use Friday to lock in whatever the week gave you (gains or lessons), journal it, and set your intention for the final full week of August, knowing another eclipse-adjacent volatility window is approaching.
The Bigger Picture
The Sun remains in Leo for nearly the entire week — confident, bold, leadership-driven energy — before beginning its shift toward analytical, detail-oriented Virgo as the week closes. That arc mirrors good trading psychology almost perfectly: lead with conviction early in the week (Leo), then shift into review-and-refine mode (Virgo) as you approach month-end.
Aligning Your Trading Energy This Week
Your chart and your nervous system are more connected than most traders admit. As you sit with this week's Scorpio First Quarter Moon, consider journaling on these before you place a single trade:
Where in my trading plan am I still avoiding a hard truth (Scorpio's specialty)?
Am I trading the order block in front of me, or the order block I wish was there?
What would it look like to act on Wednesday's tension with precision instead of urgency?
Trading and spiritual alignment aren't opposites — they're the same discipline pointed at different mirrors. The chart shows you where liquidity is hiding. The moon shows you where your impulses are hiding. Read both.
Disclaimer
This report is for educational and entertainment purposes only and reflects one trader's technical read of publicly available price data. It is not financial advice, and astrological content is offered for reflective and motivational purposes, not as a trading signal. Markets involve risk — always do your own research and manage your risk according to your own plan.
Read next on The Trader's Crib: Market & Moon Report — new breakdowns every week.
