
SPY ETF Weekly Analysis: New All-Time Highs & Candlestick Breakdown
Bulls Break the Ceiling: SPY Weekly Candlestick Breakdown and Your Cosmic Blueprint to Fight Greed
Bulls Break the Ceiling SPY Weekly Candlestick Breakdown and Your Cosmic Blueprint to Fight Greed
Bulls Break the Ceiling: SPY Weekly Candlestick Breakdown and Your Cosmic Blueprint to Fight Greed
The Daily Price Action Breakdown (May 25 – May 29, 2026)
Monday, May 25, 2026: Memorial Day Holiday
Tuesday, May 26, 2026: The Structural Gap-Up
Wednesday, May 27, 2026: The Intermission Spinning Top
Thursday, May 28, 2026: The Institutional Expansion
Friday, May 29, 2026: Blue-Sky Territory
Defining the Key Support & Resistance Matrix
1. The Daily Fair Value Gap (FVG)
What Lies Ahead: The Weekly Chart Outlook
Cosmic Alignment & Trader Psychology (June 1 – June 5, 2026)
🧠 Managing Your Psychology by the Signs
Monday, June 1 – Tuesday, June 2: Navigating the Gandanta Knot (Scorpio to Sagittarius)
Wednesday, June 3 – Thursday, June 4: The Illusions of Expansion (Sagittarius)
Friday, June 5: The Master of Rules (Capricorn)
🌌 The Energy of Focus for the Week ahead: Grounded Restraint
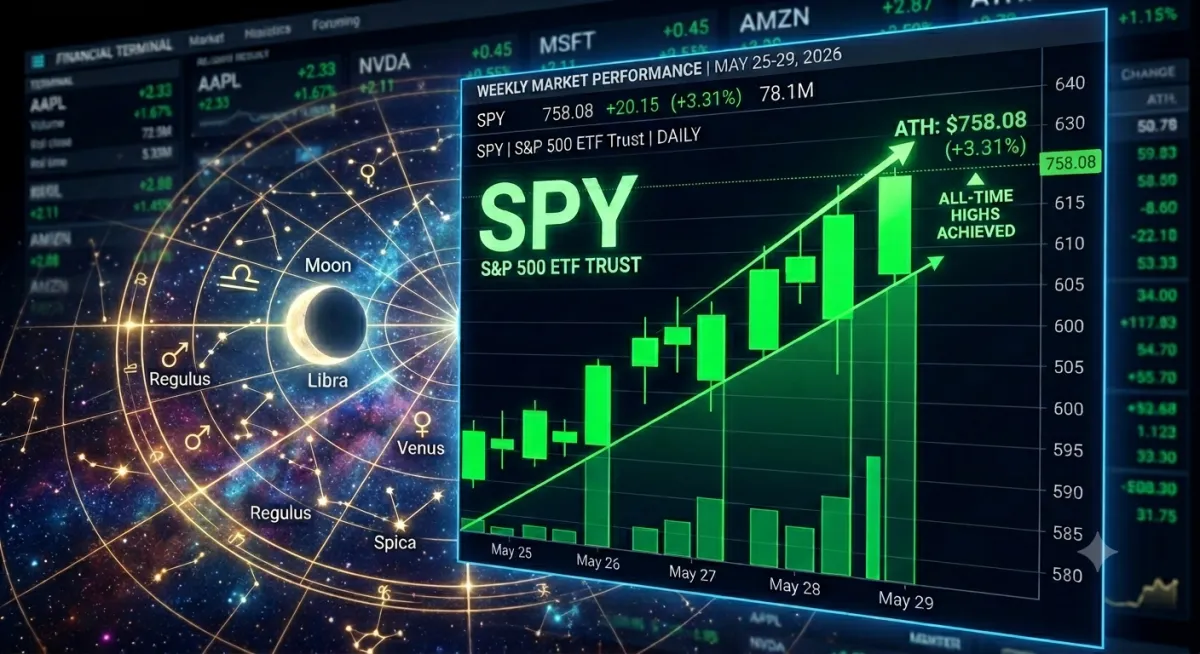
The final full week of May 2026 will go down in the books as a masterclass in institutional accumulation. Market bears who anticipated a late-spring cool-off were left completely empty-handed as the SPY (S&P 500 ETF) dismantled key overhead barriers, rallying aggressively into brand-new historic territory.
Because the week opened with a major US federal holiday, market participants had extra time to formulate their strategies—and when the opening bell finally rang, the bulls didn't waste a single second. Below is your comprehensive, day-by-day technical autopsy of the daily chart, mapped alongside the structural levels you need to watch next.
The Daily Price Action Breakdown (May 25 – May 29, 2026)
Monday, May 25, 2026: Memorial Day Holiday
The US stock market was completely closed in observance of Memorial Day. While the physical trading floors were dark, the collective market psychology was brewing. Orders stacked up over the long weekend following the previous Friday’s strong close of 745.64, setting the stage for an explosive Tuesday open.
Tuesday, May 26, 2026: The Structural Gap-Up
The trading week launched with an immediate statement of intent. SPY bypassed early liquidity pools by gapping up significantly to open at 750.01. Short-sellers attempted to push the price down during early hours to fill the weekend void, tapping a daily low of 748.37. However, aggressive institutional buyers stepped in instantly at the psychological 748 pivot. The day ended with a solid green body closing at 750.59, confirming that the new 750 domain was fiercely defended.
Wednesday, May 27, 2026: The Intermission Spinning Top
Wednesday brought a textbook consolidation candle. Opening at 750.88, the index spent the day churning within a tightly bound framework, putting in a modest high of 751.38 and a low of 748.22. It closed virtually flat at 750.46 (-0.02%). The resulting candlestick print was a small-bodied spinning top with brief upper and lower shadows. This indicated a momentary equilibrium—a brief pit stop for the bulls to catch their breath without giving up an inch of Tuesday’s hard-earned structural ground.
Thursday, May 28, 2026: The Institutional Expansion
The brief mid-week pause ended violently. Thursday's candle opened at 750.25, and from the opening bell, price action was purely one-directional. Big money stepped up to clear out leftover retail sell-orders, expanding the daily range through a long, full-bodied green Marubozu-style candle. SPY reached an intra-day high of 755.15 and closed right near its peak at 754.60. This candle single-handedly validated the broader bullish trend, signaling that the breakout was backed by true volume.
Friday, May 29, 2026: Blue-Sky Territory
Friday put the absolute exclamation point on the month of May. The index opened with another micro-gap up at 755.90. Despite a brief spell of afternoon profit-taking that tagged a low of 754.69, late-day benchmark rebalancing triggered a massive short squeeze. SPY surged to a historic, brand-new all-time high of 758.08 before settling the week out at 756.48.
Defining the Key Support & Resistance Matrix
When an asset enters "blue-sky territory" (all-time highs), mapping standard price resistance is impossible because there is no historical overhead supply. Instead, we must use smart money footprints—specifically gaps and imbalances—to identify the high-probability zones.
1. The Daily Fair Value Gap (FVG)
Because Thursday's expansion candle moved so quickly, it left behind a profound liquidity imbalance on the daily timeframe.
The FVG Range: Formed between Wednesday’s high (751.38) and Friday’s low (754.69).
Market Implication: This 3.31-point pocket is currently completely unfilled. Should the market experience a minor pullback early next week, this FVG will act like a structural trampoline. Expect institutions to heavily buy any dips into this region.
2. Concrete Support Levels
Immediate Tactical Support ($754.69): Friday's low point, which perfectly conjoins with the roof of our freshly minted Fair Value Gap.
Macro Pivot Floor ($748.00 - $750.00): This is the cluster of structural lows from early in the week. What was once a daunting psychological ceiling has now officially flipped into concrete macro support.
3. Projected Overhead Targets
Psychological Numbers ($760.00 & $765.00): In the absence of real resistance, algorithm programs routinely take profits at clean, round numbers.
What Lies Ahead: The Weekly Chart Outlook
Looking at the macro scale, the weekly candlestick closed as a massive, bullish engulfing candle that completely swallowed the price action of the prior two weeks. Closing at the absolute top 10% of the weekly range is an incredibly strong sign. Momentum belongs entirely to the bulls. Barring a drastic macroeconomic black swan, the path of least resistance points toward 760. However, don't be surprised to see a brief, healthy retest of the 754.69 FVG zone early in the week to trap impatient short-sellers before the next leg up begins.
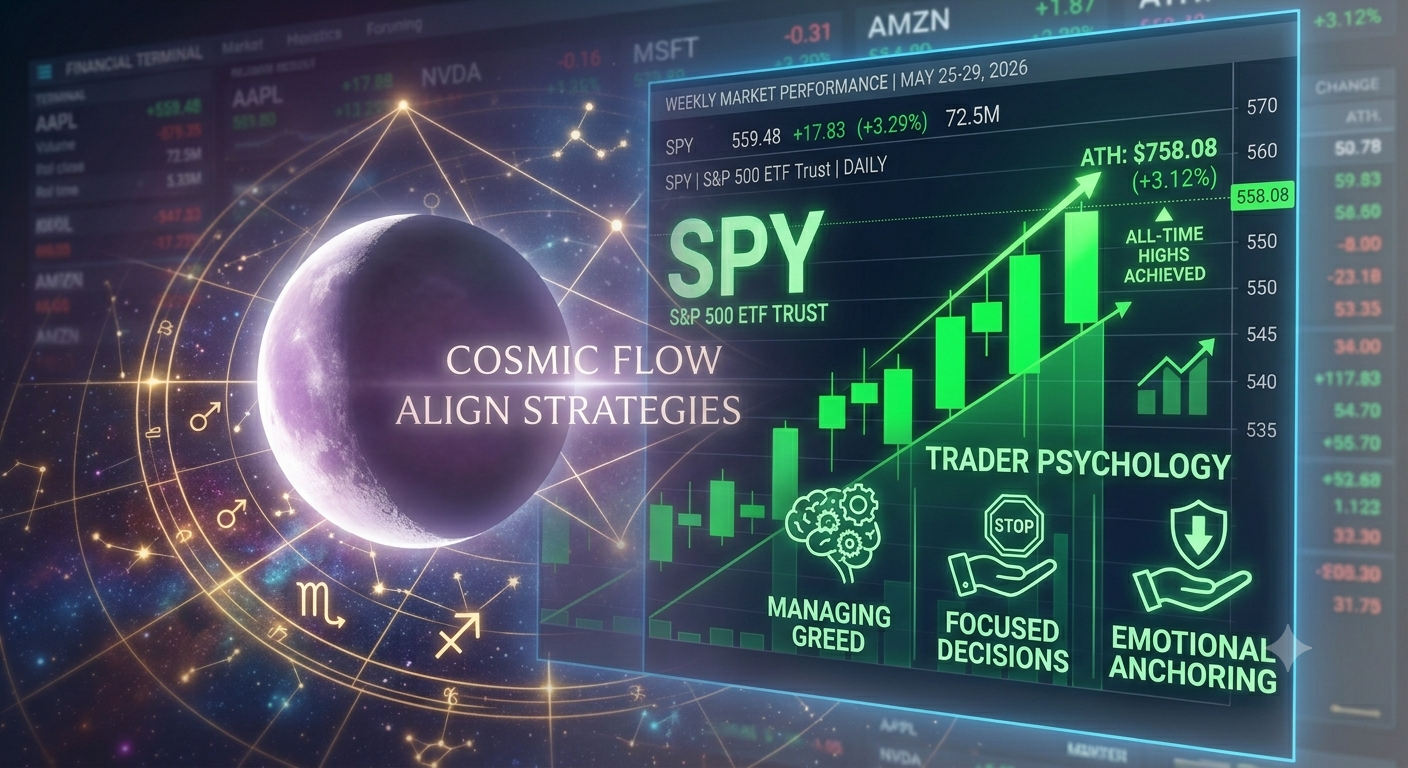
Cosmic Alignment & Trader Psychology (June 1 – June 5, 2026)
When the market enters an aggressive all-time high rally, the most dangerous enemy a trader faces isn't the market maker—it’s greed. Greed forces you to chase overextended green candles, over-leverage your account, and abandon your risk rules out of FOMO (Fear Of Missing Out).
To anchor our emotions and execute flawlessly, we look to the subtle energetic framework of Vedic Astrology (Jyotish) for the upcoming week.
🌐 The Celestial Coordinates
The Moon Phase: Waning Gibbous (Krishna Paksha)
The Moon Sign Transitions: Scorpio (Vrischika) to Sagittarius (Dhanu), concluding in Capricorn (Makara).
The Planetary Shift: Mercury enters Cancer on June 2, shifting cognitive processing from frantic data analysis to intuitive, protective pacing.
🧠 Managing Your Psychology by the Signs
Monday, June 1 – Tuesday, June 2: Navigating the Gandanta Knot (Scorpio to Sagittarius)
The week begins with the waning Moon crossing the volatile boundary between watery Scorpio (Jyeshtha Nakshatra) and fiery Sagittarius (Moola Nakshatra). In Vedic astrology, this boundary is called Gandanta—a karmic knot of intense transition.
The Trading Pitfall: Monday morning will bring a heavy, frantic energy. You might feel an overpowering, anxious urge to jump into positions prematurely or forcefully hit buttons because you feel you "missed the move" last week.
The Cosmic Strategy: Practice total emotional restraint. Do not trade the first 60 to 90 minutes of the week. Let the market establish its direction while the emotional knot unties itself.
Wednesday, June 3 – Thursday, June 4: The Illusions of Expansion (Sagittarius)
As the Moon settles comfortably into Sagittarius, optimism returns to the market floor. However, because the Moon is waning (losing light), this optimism can easily warp into blind overconfidence.
The Trading Pitfall: This is exactly where greed tells you to double your standard risk size because "the market can't possibly pull down."
The Cosmic Strategy: A waning moon means it is time to reap, not over-extend. Focus on trailing your stop-losses higher on existing positions and taking partial profits near the 760 extension. Do not deploy heavy new capital at the absolute structural ceiling.
Friday, June 5: The Master of Rules (Capricorn)
The trading week closes with the Moon entering pragmatic, disciplined Capricorn. Capricorn has zero tolerance for fluff, emotional outbursts, or gambling.
The Trading Pitfall: Trying to trade messy, low-probability end-of-week chop out of boredom.
The Cosmic Strategy: Treat Friday like a strict corporate audit. Rely entirely on your concrete trading plan. If the SPY doesn't pull back neatly into your defined 754.69 Fair Value Gap, walk away from the screens.
🌌 The Energy of Focus for the Week ahead: Grounded Restraint
"Last week belonged to the explosive power of the market bulls, but this upcoming week belongs entirely to the disciplined sovereign trader. The waning cosmic light reminds us that true wealth is kept through conservation, not reckless chasing. When greed whispers in your ear to over-leverage at an all-time high, leverage the pragmatic energy of the incoming Capricorn moon instead. Take your profits, tighten your risk parameters, and let the market come to you. Trading in absolute harmony with the universe means knowing exactly when to step away from the battlefield and secure your harvest."
