
SPY June Whiplash: Trading Insights & Astrology
Trading Psychology, SPY Price Action, Vedic Astrology
From Calm Grind to Sharp Drop: Reading SPY’s June Whiplash Week
A trader-focused breakdown of SPY’s June 1–5, 2026 price action, key candlestick signals, fair value gaps, and order blocks—plus Vedic astrology insights and a mindset roadmap for the week of June 8–12, 2026.
Weekly Snapshot: What SPY Actually Did, June 1–5, 2026
The SPDR S&P 500 ETF Trust (SPY) spent most of the week of June 1–5, 2026 grinding sideways to slightly higher—only to finish with a sharp Friday sell-off that reset the tone completely.
Source data: StockAnalysis.com and related historical SPY records (stockanalysis.com).
📌 Key Takeaway: The weekly candle hides a quiet, low-volatility drift early in the week and a violent liquidation on Friday. Your edge comes from understanding how that structure builds, not just staring at the final weekly bar.
The Weekly Candlestick: Calm Body, Aggressive Tail
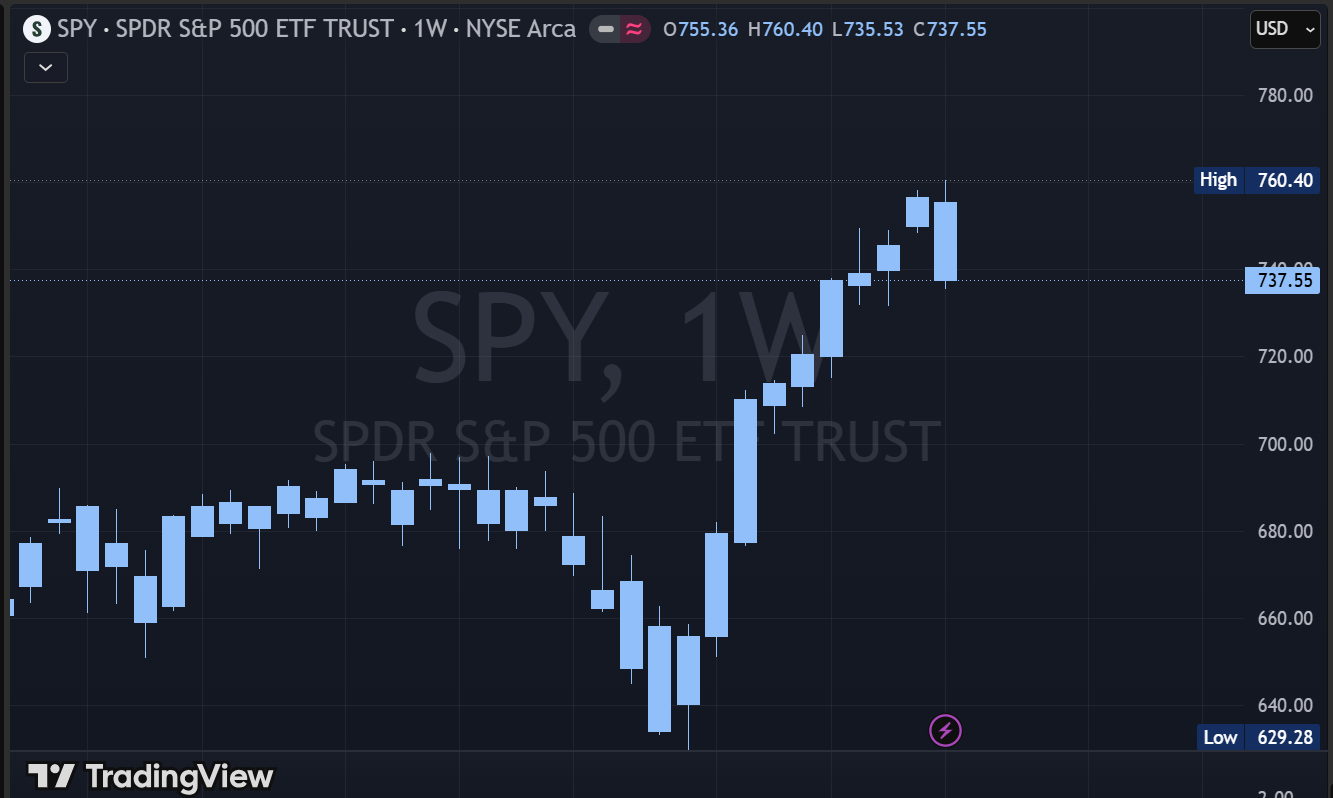
On a weekly chart, June 1–5 likely prints as a bearish candle with a relatively small upper wick and a long lower tail: price pushed modestly higher early in the week, then sellers took control and drove SPY down almost 3% from Tuesday’s close to Friday’s close.
Structure: A close well below the weekly open with a long lower shadow suggests aggressive late-week selling but also some responsive buying off the lows (since the low was 735.53 and the close bounced to 737.55).
Psychology: Bulls who chased the slow grind higher early in the week are now trapped near 758–760. That zone becomes a potential weekly bearish order block and resistance for the following week.
For swing traders, this weekly bar says: “The uptrend paused, liquidity was swept below, and now the market must decide whether this was a one ‑day flush or the start of a deeper repricing.”
Day‑by‑Day Breakdown: Candles, Fair Value Gaps, and Order Blocks
Monday, June 1, 2026 – Small Bull Candle, Liquidity Building Above
Monday opened at 755.36 and closed at 758.54, a mild +0.27% gain with a narrow intraday range (low 754.69, high 760.28). Structurally, this looks like a small-bodied bullish candle near the upper end of the recent range.
Candlestick read: A “grind up” candle—buyers in control but without urgency. This often precedes a liquidity grab higher as algos push into stops above prior highs.
Fair value gaps (FVGs): On lower timeframes (e.g., 15‑minute), such a steady day often leaves small upside FVGs as price walks higher. These act as intraday demand pockets for dip‑buyers on Tuesday.
💡 Psychology cue: Don’t over‑celebrate green Mondays. A calm, tight‑range up day often means the real battle hasn’t started yet. Treat early‑week gains as information, not validation.
Tuesday, June 2, 2026 – Subtle Upthrust Near Highs
Tuesday opened slightly lower (757.03) and closed marginally higher at 759.57 (+0.14%), printing the weekly high at 760.40. This creates what many traders see as a potential “upthrust” or liquidity sweep above Monday’s high.
Candlestick pattern: A small bullish candle, but importantly, it extends the high just slightly. In some price‑action frameworks, this is the “last push” that fills buy‑side liquidity before a reversal.
Order block: The tight cluster of Monday–Tuesday highs around 760 forms a short‑term supply zone. If, in the coming week, SPY rallies back into 758–760 and stalls, that area can behave as a bearish order block where sellers re‑enter.

Tight clusters of highs often evolve into future supply zones where trapped buyers exit.
Wednesday, June 3, 2026 – First Real Pullback, Testing Demand
Wednesday opened at 758.15 and closed at 754.24 (−0.70%), with a low of 753.57. After the quiet grind up, this is the first clear counter‑move candle.
Candlestick pattern: A moderate‑sized bearish body without dramatic wicks suggests controlled selling rather than panic. Think of it as “testing the bid.”
Fair value gaps: If the open was near Tuesday’s close and price slid intraday, you may see a downside FVG between Tuesday’s late‑session prices and Wednesday’s early drop on intraday charts. That gap becomes a short‑term magnet and potential resistance on any Thursday bounce.
💡 Psychology cue: This is where many traders start doubting their bullish bias. The key is to ask, “Is this a shift in structure or just a normal check of demand?” and size risk accordingly.
Thursday, June 4, 2026 – Rebound into Resistance
Thursday gapped slightly down (open 752.10), dipped to 751.47, then recovered to close at 757.09 (+0.38%). That’s a decent bounce off the prior day’s low area.
Candlestick pattern: This candle likely resembles a bullish rejection from support—a lower tail with a close near the upper half of the range. It tells us buyers still exist around 751–753.
Order blocks and FVGs: Thursday’s rally back toward 757 begins to re‑test Wednesday’s downside FVG and the lower edge of the 758–760 supply zone. If you saw rejection there on intraday charts, that’s the market quietly handing you a bearish confluence before Friday’s drop.
Friday, June 5, 2026 – The Liquidation Flush
Friday is where the weekly story changes. SPY opened at 752.31 and closed at 737.55 (−2.58%), after hitting a low of 735.53. Volume spiked to roughly 84–94 million shares, far above earlier in the week (stockanalysis.com) .
Candlestick pattern: A strong, wide‑range bearish candle—almost a marubozu‑style body if wicks are small, or a long‑body candle with a modest lower wick. Either way, it screams decisive control by sellers.
Fair value gaps: The speed of the drop likely left downside FVGs on the 30‑minute and 1‑hour charts between Thursday’s consolidation and Friday’s sharp move. Those unfilled areas above price (roughly 745–752, depending on your timeframe) become future draw targets if the market bounces next week.
Order blocks: The last significant bullish candle before the Friday breakdown—likely a late‑Thursday or early‑Friday intraday up candle—can be marked as a bearish order block. That’s where institutional selling may have initiated the move. Expect reactions if price revisits that zone.
⚠️ Psychology cue: Big red days trigger fear, revenge‑trading, and FOMO on “catching the bottom.” Your job is not to predict the exact low; it’s to protect capital and wait for clear structure to re‑emerge.
Mapping the Zones: Where Are the Key Fair Value Gaps and Order Blocks?
Without your exact intraday chart, we can still outline the logical price zones that matter going into the next week:
Weekly supply / bearish order block:758–760 (clustered Monday–Tuesday highs and Tuesday’s liquidity sweep). If SPY rallies back into this area, expect responsive selling unless the market is truly reclaiming strength.
Downside FVG “air pockets” above price: Roughly 745–752, carved out during Friday’s fast move. These are likely to be revisited at some point; the question is when, not if.
Short‑term demand / potential bullish order block: The area near Friday’s low 735–738 where price bounced into the close. If buyers defend this zone early next week, it can evolve into a tradable support region.
Price Action Outlook for the Week of June 8–12, 2026
This is a probabilistic outlook based on structure, not a guarantee. Markets are influenced by macro data, headlines, and flows that can change quickly. Use this as a framework, not a script.
Primary scenario: Early‑week stabilization or mild bounce from the 735–738 area, with price attempting to retrace part of Friday’s move into the 745–752 downside FVG. Here, you watch for rejection or acceptance: do sellers step back in, or does volume confirm a real recovery?
Bearish continuation risk: If 735–738 fails decisively, SPY could explore lower liquidity pools below Friday’s low. In that case, your job is to avoid averaging down blindly and instead wait for a fresh bullish order block or clear reversal pattern on daily or 4‑hour charts.
Less likely, but important: A V‑shaped recovery that powers straight back through 752 and challenges 758–760. If that happens with strong breadth and volume, it suggests Friday was a one‑off liquidation rather than the beginning of a larger trend change.
📌 Trading psychology guide for the new week:
1. Define your invalidation level before entering any trade.
2. Size smaller after a big volatility spike—your edge is clarity, not aggression.
3. Let price come to your zones (735–738 support, 745–752 FVG, 758–760 supply) instead of chasing intraday noise.
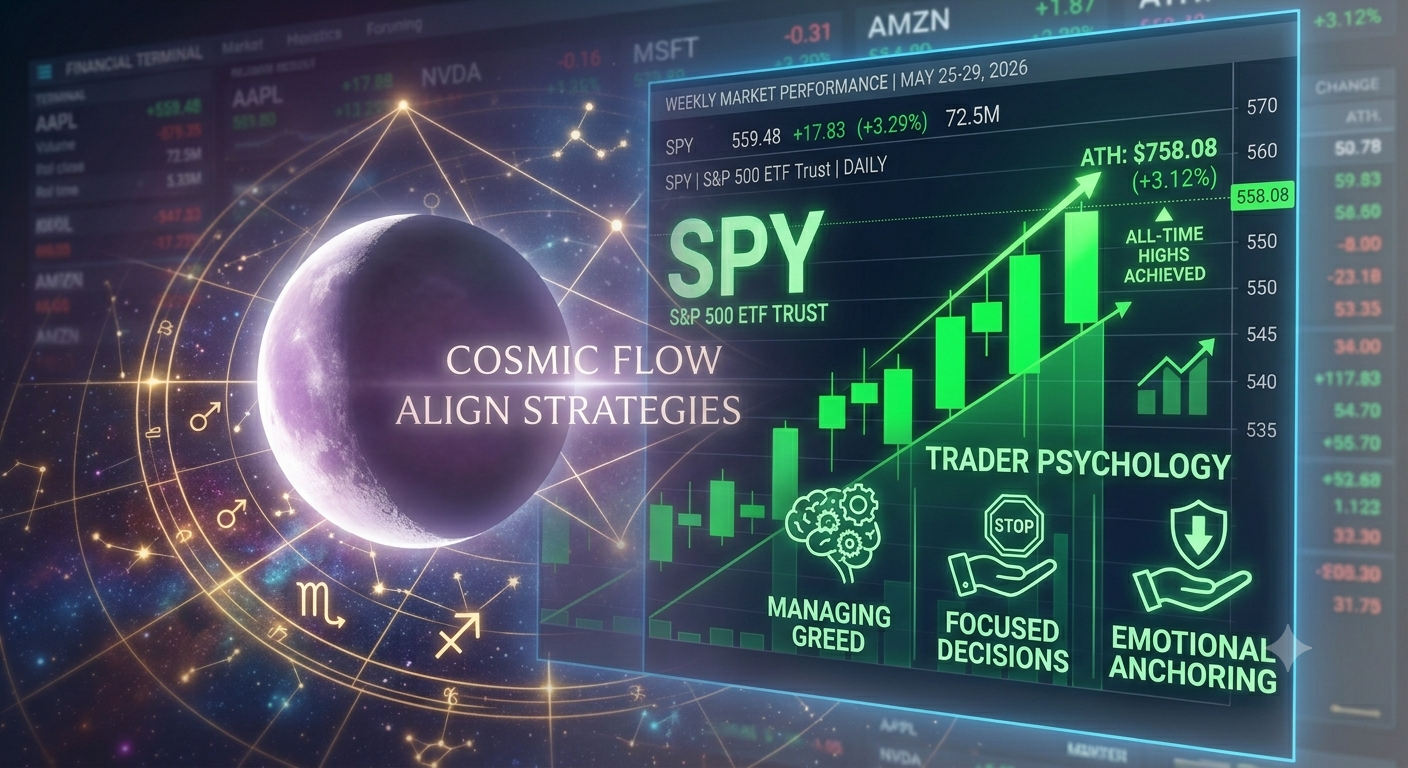
Astrology Lens: Moon Phases and Energies, June 8–12, 2026
In astrology, the Moon rules our mind, emotions, and moment‑to‑moment perception—exactly what drives trading decisions. While precise nakshatra and sign positions require an ephemeris, we can still align with the broader moon phases and their traditional energies as they move through different signs (timeanddate.com) , (astrology.com) .
For this particular week, the Moon starts in a third‑quarter phase in Aquarius—emphasizing detachment, review, and course correction—then transitions through subsequent phases and signs to finish the week in Aries, in a disseminating, winding‑down arc toward the next New Moon. Below is a trader‑oriented guide for Monday–Friday, June 8–12, 2026, translated into practical trading focus.
Monday, June 8, 2026 – Third‑Quarter Moon in Aquarius: Detachment and System Review
In Vedic thought, a third‑quarter Moon emphasizes release, objectivity, and course correction, while Aquarius adds a cool, analytical, systems‑driven tone. This is a day to step back from ego and reconnect with your bigger trading framework.
Energy of focus: Audit your SPY playbook rather than hunt for new risk. Re‑check how your zones—735–738 support, 745–752 FVG, 758–760 supply—fit into your overall system and note where you might be emotionally attached instead of data‑driven.
Psychology practice: Do a short “detachment check”: ask, “If I were advising another trader, what would I tell them to do here?” Let that cooler Aquarian perspective guide your position sizing and whether certain trades should be reduced or closed.
Tuesday, June 9, 2026 – Balsamic Moon: From Aquarian Insight to Piscean Surrender
As the Moon moves from late Aquarius into Pisces and slips into its balsamic phase, the tone shifts from cool, mental analysis toward release, intuition, and quiet integration. This is less about forcing decisions and more about letting the dust settle on what you learned from Monday’s review.
Energy of focus: Trade lighter and listen more. If you act, do it only on high‑conviction, well‑defined setups that already align with your plan; otherwise, allow the market to move while you observe how SPY behaves around your key zones.
Psychology practice: Notice any urge to “make something happen” and gently let it go. Take a few breaths and remind yourself: “Balsamic Moon is for clearing, not clinging.” Use that Piscean energy to release attachment to specific outcomes and stay flexible.
Wednesday, June 10, 2026 – Balsamic Moon in Pisces: Deep Integration and Gentle Adjustments
With the Moon still in its balsamic phase and now settled into Pisces, the emphasis is on integration, quiet release, and subtle course‑correction. This is still not the day to force fresh risk; it’s a day to tend to what you already have with softness and precision.
Energy of focus: Make only gentle adjustments—tighten stops a bit, trim partial profits, or gracefully exit trades that clearly no longer fit your SPY plan. Let Piscean sensitivity help you notice where you’re forcing versus flowing with the evolving price action around your zones.
Psychology practice: At the close, journal one paragraph beginning with: “Today I’m ready to release…” and list any fears, attachments, or trade ideas you’re willing to let go of. This keeps you listening to the market instead of imposing your will on it.
Thursday, June 11, 2026 – Moon from Pisces to Aries: Emotional Surge into Action
As the Moon shifts from watery, intuitive Pisces into fiery, impulsive Aries, emotional energy can flip quickly into urgency, initiative, and a desire to act now. Markets may see sharper intraday swings as traders rush to express new views or defend existing ones.
Energy of focus: Let the market show its hand, but don’t let Aries fire push you into over‑trading. This is a day to observe decisive moves—does SPY drive aggressively into the 758–760 supply or reject hard from 745–752 and rush back toward 735–738? Let others react impulsively while you stay anchored to your levels.
Psychology practice: Keep your normal position size trimmed. If you usually risk 1% per trade, risk 0.5%, and add only if structure clearly confirms your thesis. Use the Aries drive for decisive execution of planned trades, not for impulsive entries.
Friday, June 12, 2026 – Aries Moon Close: Direct Action and Weekly Wrap‑Up
With the Moon now moving fully through Aries as the trading week ends, the tone is decisive, action‑oriented, and forward‑looking. This fire sign favors clean moves over lingering indecision—ideal for closing the book on this week’s SPY story and positioning for the next.
Energy of focus: Make clear, intentional decisions. Either commit to the positions that still align with your SPY thesis or flatten anything you’re only “hoping” will work. Use Aries clarity to end the week with a portfolio you’d be comfortable holding over the weekend.
Psychology practice: Do a quick end‑of‑week check‑in: “What did I execute boldly and well, and where did hesitation or impulse show up?” Let the Aries Moon help you turn those insights into one or two concrete adjustments for next week, rather than a long list of self‑criticism.
Integrating Price Action and Moon Cycles into a Practical Trading Routine
You don’t need to “believe in astrology” to benefit from this framework. Think of Vedic moon phases as a structured reflection tool layered on top of your technical work:
Use price action—candles, fair value gaps, order blocks—to define your objective zones on SPY.
Use moon phase themes—planning, action, refinement, amplification, release—to schedule how you engage with those zones: when you plan, when you act, when you reduce, and when you reflect.
💡 Final mindset shift: Your edge isn’t predicting every tick of SPY. It’s staying centered while price moves between clearly defined levels—and using every week, every candle, and even every moon phase as a teacher rather than a trigger.
