
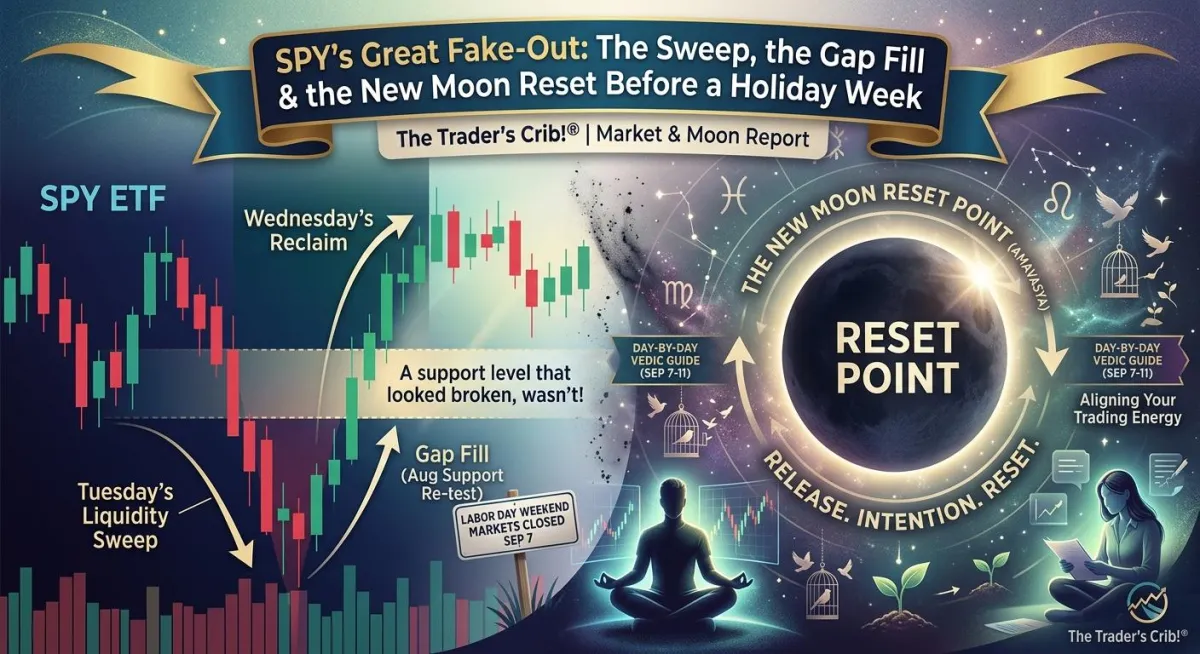
SPY's Great Fake-Out: The Sweep, the Gap Fill & the New Moon Reset Before a Holiday Week
The Trader's Crib!® | Market & Moon Report
Welcome Back to the Crib
This week gave us one of the cleanest teaching moments we've had in a while — a support level that looked broken, wasn't, and a gap that had been sitting open since early August that finally, finally got touched. No indicators, just price, structure, and candles. We're breaking down Monday, August 31 through Friday, September 4, 2026, then heading into a holiday-shortened trading week — Monday, September 7 is Labor Day, markets closed — with both a price forecast and a full Vedic astrology read for September 7–11, the week that carries this month's New Moon.
The Higher-Timeframe Anchor: What We Were Carrying Into This Week
Last week closed at 769.35 after a shooting-star rejection right at the top of the large fair value gap from mid-August (772.47–775.43). The two open questions heading into this week: would the new 767.35–768.31 support hold, and if it didn't, would the two-week-old double bottom at 762.04–762.08 finally give way?
It gave way — but not in the way it looked at first.
Daily Breakdown: Monday, August 31 – Friday, September 4, 2026
Monday, August 31 — The Quiet Retest
SPY opened at 767.33, dipped to 764.72, and closed at 767.05 — a small, fairly unremarkable candle on its own. But the low of the day landed right inside last week's bullish order block (762.08–766.78), and price bounced from there. Quiet, but structurally important: the level held on its first retest.
Tuesday, September 1 — The Sweep
This is the candle of the week. SPY gapped down hard overnight — Monday closed at 767.05, Tuesday opened at 762.01, a genuine 5.04-point gap, one of the largest single overnight gaps we've tracked in this report. There's also a true, textbook price gap sitting between Monday's low (764.72) and Tuesday's high (764.67) — a sliver of untraded price that the chart simply skipped over.
Tuesday continued down to 759.48 before closing at 761.78 — a small-bodied, doji-like candle with long wicks on both sides. That low broke clean through the two-week double-bottom support at 762.04–762.08, and traded directly into the large fair value gap at 748.90–760.52 that's been sitting open, untouched, since early August. Nearly a month later, that gap finally got its first visit.
Here's the nuance that matters: breaking a well-known support level isn't automatically bearish. When price dips just below an obvious level, grabs the liquidity (the stop-losses) sitting there, and snaps back quickly, that's a classic liquidity sweep — a fake-out, not a breakdown. Tuesday's low, on its own, looked like disaster. What happened next confirmed it was a setup.
Wednesday, September 2 — The Reclaim
Wednesday opened at 762.45, right back inside Tuesday's range, and rallied to close at 765.16 — a strong bullish candle that reclaimed the entire double-bottom zone in a single session. This candle, launching directly out of Tuesday's range, makes 759.48–764.67 this week's bullish order block — the sweep-and-reverse zone the rest of the week's rally was built from.
Thursday, September 3 — The Big Green Candle
Thursday gapped up to open at 767.90 and closed at 773.17 — a near-marubozu bullish candle and the strongest single session of the week. This candle pushed back into the large fair value gap from mid-August (772.47–775.43) for a second time in two weeks, this time closing right inside it rather than rejecting immediately. It also left behind two small, stacked, unfilled fair value gaps just beneath it — roughly 764.67–769.00 — the fresh support shelf for next week.
Friday, September 4 — The Pre-Holiday Pause
Friday opened at 772.01, drifted down, and closed at 770.19 — a bearish digestion candle after Thursday's strong push. Nothing alarming here: pullbacks after big green candles are normal, and Friday ahead of a three-day Labor Day weekend is exactly the kind of session where volume thins out and positions get trimmed rather than added. Friday's low (769.00) sits right on top of the fresh fair value gap shelf from Thursday — the first real test of that new support will come next week.
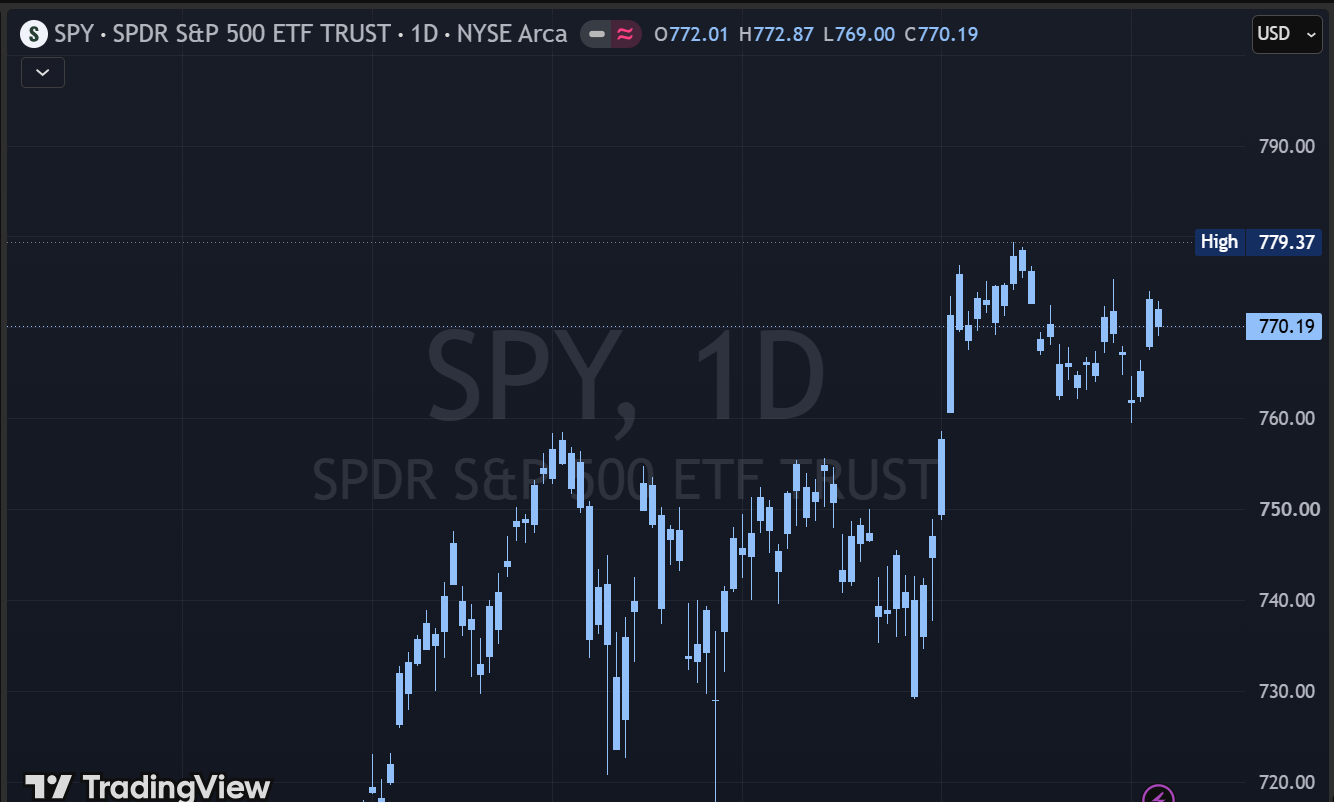
Weekly Summary: A Fake-Out, Not a Breakdown
The weekly candle: open 767.33 (Monday), high 774.03 (Thursday), low 759.48 (Tuesday), close 770.19 (Friday) — a bullish weekly candle that closed above where it opened despite a dramatic swing through the middle. The headline structural facts:
Swept the two-week double-bottom support (762.04–762.08) with Tuesday's low of 759.48 — then reclaimed it entirely by Wednesday's close.
Touched the deep fair value gap (748.90–760.52) for the first time since it formed in early August, partially filling its upper edge.
Built a fresh bullish order block at 759.48–764.67, the origin of the week's reversal.
Re-tested (and this time held inside) the large bearish fair value gap from mid-August (772.47–775.43).
Left behind a new, stacked support shelf at roughly 764.67–769.00, unfilled and untested going into next week.
In plain terms: this was the market shaking out the obvious, well-known level before continuing higher — a pattern worth remembering, because it will happen again.
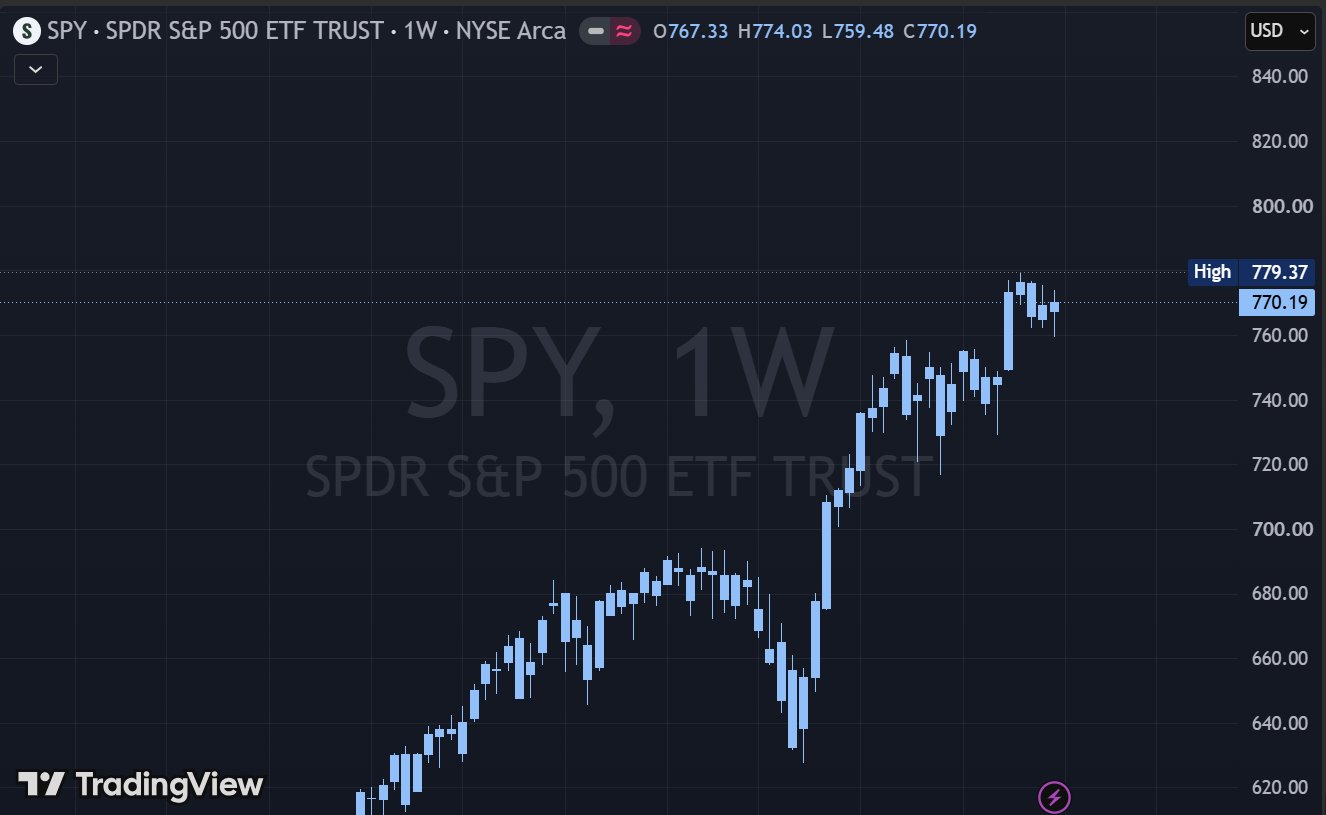
The Week Ahead: SPY Outlook for September 7–11, 2026 (Holiday Week)
Markets are closed Monday, September 7 for Labor Day. This is a four-day trading week — Tuesday through Friday — and holiday-adjacent weeks typically carry lighter volume both into the long weekend (which we may have already seen in Friday's pullback) and coming out of it, as traders reposition after three days away from the desk. Expect Tuesday to potentially set the real tone for the week, functioning like the "Monday" this week doesn't have.
Bull case: Holding above the new 764.67–769.00 fair value gap shelf keeps this reversal intact, with room to push back through Thursday's 774.03 high and retest the untouched all-time high at 779.37.
Bear case: A close back below 764.67 reopens the door to the 759.48 low — and if that breaks on a second visit, the 748.90–760.52 fair value gap (now tagged once) becomes a much more likely full fill.
Worth watching in the background: September has a well-known reputation as historically one of the market's weaker months, and there's real financial commentary this week debating whether that pattern holds this year or not. We're not forecasting off seasonality — only price — but it's context worth knowing as you size positions into a lower-volume week.

Moon Phases, Signs & Energy: A Vedic Read for September 7–11, 2026
This week carries us to this month's New Moon (Amavasya) — a genuine reset point on the lunar calendar, landing in the same week as a market holiday. Here's the day-by-day, and how to actually use it.
Monday, September 7 — Labor Day (Market Closed) — Moon in Mithuna/Karka transition, Nakshatra Punarvasu, Tithi Krishna Ekadashi
Ekadashi is traditionally a day of fasting and restraint in Vedic practice — stepping back from indulgence for the sake of clarity. It's a fitting overlap with a holiday built around stepping back from labor. Punarvasu means "the return of the light," ruled by Aditi, associated with renewal and second chances. Energy of focus: since the market's closed anyway, let this actually be a day of rest rather than one more day of chart-watching. Use the quiet to review last week's trades with a clear head, not a reactive one.
Tuesday, September 8 — Moon in Karka (Cancer), Nakshatra Pushya
Pushya is considered one of the most nourishing, auspicious nakshatras in the entire system — associated with spiritual growth, care, and steady prosperity. Cancer energy is protective and intuitive. Energy of focus: this is the real first trading day of the week, effectively standing in for Monday — plan your positions with the same care Pushya represents: nourish your plan, don't rush it.
Wednesday, September 9 — Moon in Karka (Cancer), Nakshatra Ashlesha
Ashlesha is intense — "the entwiner," associated with deep intuition, hidden patterns, and a serpentine, coiled kind of energy that can feel hypnotic or overwhelming if you're not grounded. Energy of focus: if the market gets choppy or emotionally triggering today, that's Ashlesha, not a sign your strategy is broken. Trust your read, but double-check you're not spiraling on a single red candle.
Thursday, September 10 — Moon in Simha (Leo), Nakshatra Magha — New Moon (Amavasya)
The week's centerpiece: the New Moon lands in Magha, a nakshatra governed by the Pitris (ancestral spirits) and tied to leadership, legacy, and honoring where you came from. New Moons are traditionally for release and quiet intention-setting rather than loud action. Energy of focus: this is a release day, not a launch day — close out a trade you've been holding onto out of stubbornness, clear your workspace, and set (don't announce) your intention for the new lunar cycle.
Friday, September 11 — Moon in Simha (Leo), Nakshatra Purva Phalguni, Tithi Shukla Pratipada
The first day of the new waxing cycle, right after the New Moon, lands in Purva Phalguni — a nakshatra ruled by Bhaga, the god of delight, associated with rest, creativity, and enjoyment rather than hustle. Energy of focus: ease into the new cycle instead of sprinting into it. If the week went well, let Friday be enjoyed, not immediately re-risked.

Aligning Your Trading Energy This Week
This week's chart and this week's sky are telling the same story from two directions: what looks like a breakdown (Tuesday's sweep, Ekadashi's restraint) is often just the setup for what comes next (Wednesday's reclaim, Pushya's nourishment) — and the real reset (the New Moon) asks for release, not force. Sit with this before you trade:
Where this week am I mistaking a shakeout for a real breakdown — in the market, or in my own plan?
What am I still holding onto that Thursday's New Moon is actually asking me to release?
Can Friday be an actual rest day, or am I already planning to work through it?
The chart swept the obvious level to find out who'd panic. The sky, this week, is asking the same question of you.
Disclaimer
This report is for educational and entertainment purposes only and reflects one trader's technical read of publicly available price data. It is not financial advice. Vedic astrological content is offered for reflective and motivational purposes, not as a trading signal or religious authority — timings are approximate and can vary by location. Markets involve risk — always do your own research and manage risk according to your own plan.
Read next on The Trader's Crib!®: Market & Moon Report — new breakdowns every week.
