
SPY’s U-Turn: Market Recap & Astro Insights
Trading, Market Recap, SPY, Astrology
SPY’s U‑Turn Week: From Mid‑Week Flush to Full Recovery and What Comes Next
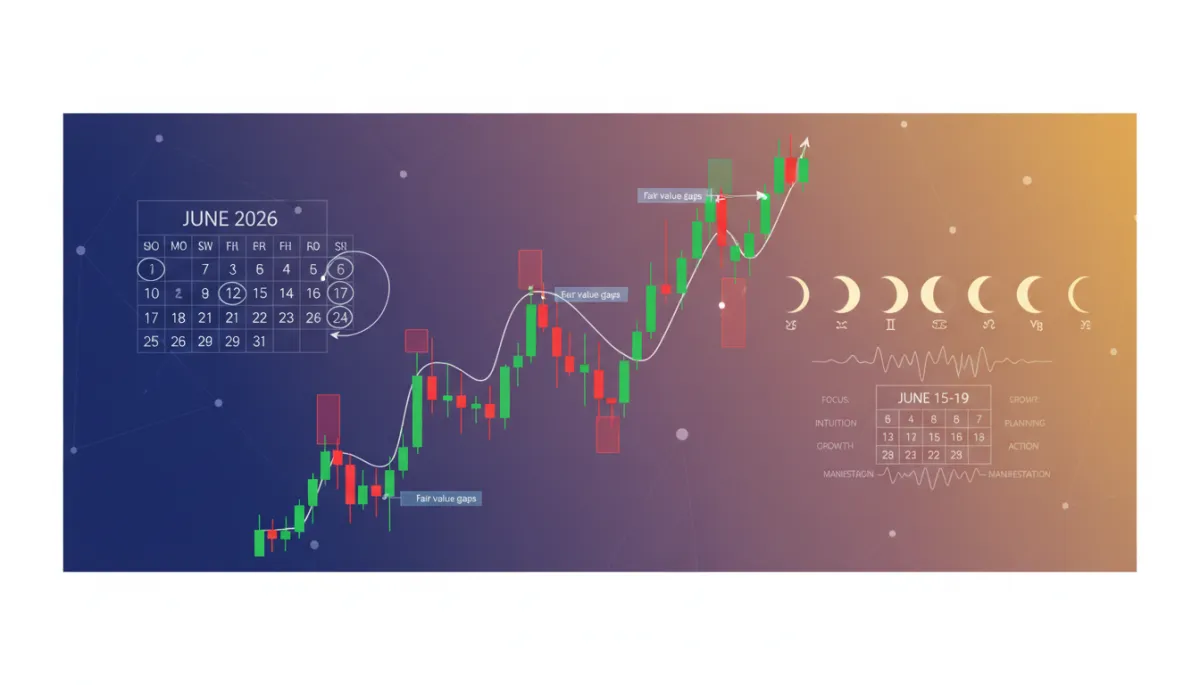
A trader‑focused breakdown of SPY’s price action from June 8–12, 2026, including key candlestick structures, fair value gaps, and order blocks—plus an astro‑aligned outlook and moon‑phase guide for planning trades in the week of June 15–19, 2026.
Big Picture: SPY’s U‑Shaped Recovery (June 8–12, 2026)
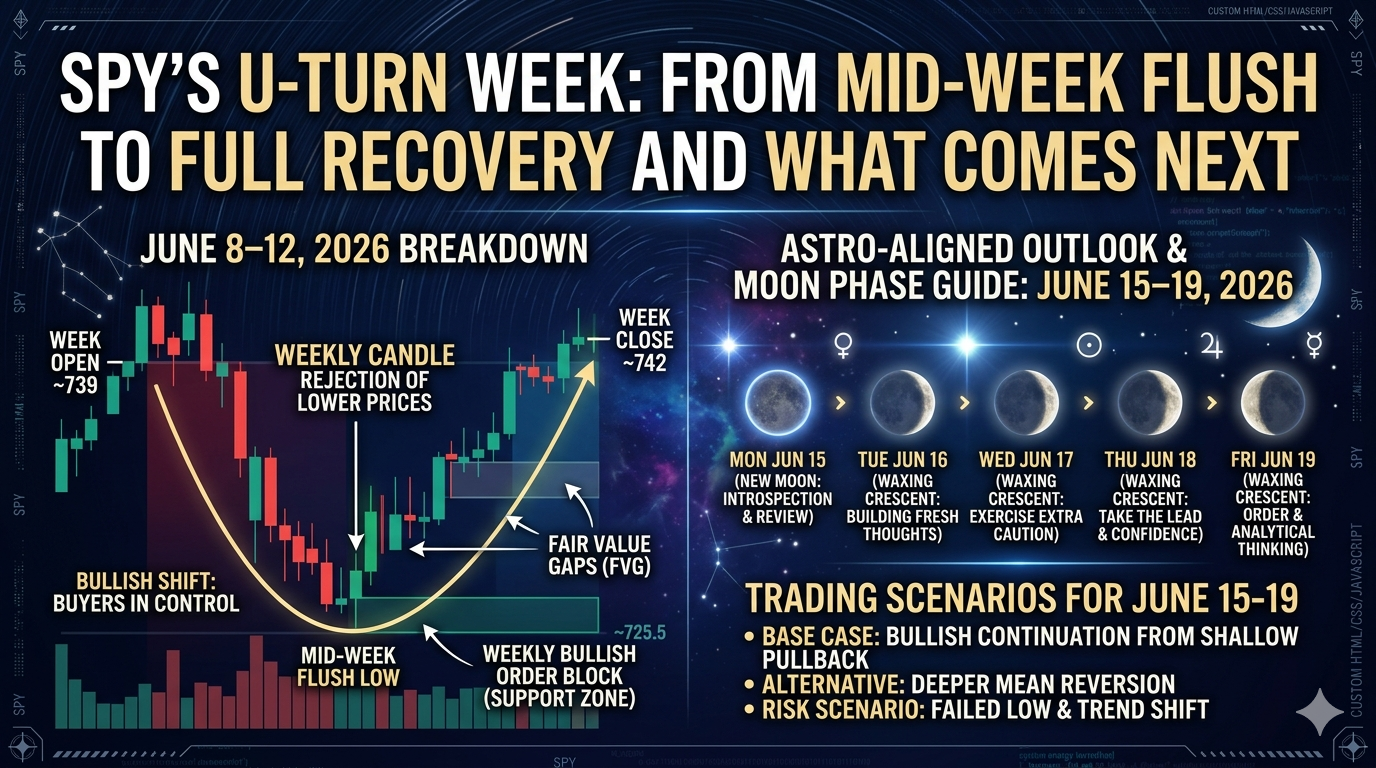
SPY (SPDR S&P 500 ETF Trust) delivered a classic U‑shaped week from Monday June 8, 2026 through Friday June 12, 2026. After a soft start and a sharp mid‑week flush, buyers stepped in aggressively, driving price to finish the week above Monday’s close.
Using closing prices sourced from FinancialContent and cross‑checked with StatMuse, the week’s closes were:
That trajectory—early‑week softness, a mid‑week low, and late‑week strength—produced a weekly candle that likely resembles a long‑wicked hammer or bullish pin bar off support, with a close slightly above the open. For many traders, this is a textbook sign of rejection of lower prices and a potential continuation higher, provided key levels hold.
📌 Key Takeaway: The week ended with buyers firmly in control, defending a mid‑week discount and closing at new weekly highs. Any plan for next week should respect that bullish shift while staying aware of overhead liquidity.
Weekly Candlestick Structure: Where the Smart Money Stepped In
Even without every intraday tick, the weekly structure from June 8–12, 2026 tells a clear story. Price opened the week near 739, dipped roughly 2%–2.5% into mid‑week, then powered back to close near 742. This kind of price action often reflects:
Stop‑run / liquidity grab below prior lows mid‑week.
Institutional accumulation in a discount zone (a weekly bullish order block).
A likely fair value gap (FVG) created on the way down or up, which price may revisit in the coming sessions.
If you plot the weekly candle, you are likely seeing a long lower shadow with a close near the upper third of the range—classic for a bullish rejection of lower prices after a mid‑week flush.
Day‑by‑Day Breakdown: Candles, Fair Value Gaps, and Order Blocks
Monday June 8, 2026 – Cautious Open, Setting the Range
Monday’s close at 739.22 came after the prior week’s softness. Without intraday OHLC, we can infer that Monday likely printed a relatively balanced candle, potentially a small‑bodied candle or doji‑type structure, as volume was moderate at ~49M compared with the heavier days that followed. This session helped establish the initial weekly range and provided a reference point for later liquidity runs.
Intraday bias: Likely two‑sided, with both buyers and sellers probing around 739.
Potential fair value gaps: Any fast moves away from Friday’s prior close into Monday’s range could have left a small FVG on the 15–60 minute charts. Mark those zones as areas where price may rebalance later in the week.
Order blocks: If Monday’s low held above the prior week’s low, the last bearish candle before any intraday impulsive move up can be treated as a small bullish intraday order block for reference.
Tuesday June 9, 2026 – Controlled Drift Lower, Liquidity Building
Tuesday closed slightly lower, around 737, on significantly higher volume (~87M). That combination—small net move, big volume—often hints at absorption: large players taking the other side of retail selling into the dip. The daily candle likely resembled a small‑bodied bearish bar or even a spinning top, closing under Monday’s close but without a dramatic breakdown.
Candle pattern: Mild continuation lower, potentially the first leg of a three‑day swing low pattern that would complete on Wednesday.
Fair value gaps: If Tuesday drove quickly away from Monday’s intraday consolidation, look for a small bearish FVG above price—these zones can serve as future resistance and short‑term targets for Thursday–Friday’s rebound.
Order blocks: Any late‑day bearish candle that precedes a fast move down into Wednesday’s low may later act as a bearish order block, where price could react if it trades back into that area.
Wednesday June 10, 2026 – The Flush: Weekly Low and Bullish Rejection Zone
Wednesday was the inflection point of the week. SPY closed around 725.5, roughly 1.5%–2% below Tuesday’s close, marking the weekly low. Volume remained elevated at ~60M. This session likely printed a long‑wicked candle—either a hammer or a candle with a deep lower shadow—signaling aggressive buying from a discount zone relative to recent highs.
Candle pattern: Potential daily swing low and the middle bar of a three‑candle reversal pattern (Tuesday–Wednesday–Thursday). If Thursday closed back above Wednesday’s midpoint, this reinforces the swing low narrative.
Bullish order block: On the 4‑hour or daily chart, the last down candle before the sharp move up into Thursday can be treated as a bullish order block. That zone—roughly around the 725–730 area—becomes a key support reference for the coming week. If price revisits it, watch for responsive buyers.
Fair value gaps: Any aggressive sell‑off from Tuesday into early Wednesday may have left a downside FVG above price, which Thursday and Friday’s rally likely started to fill. Conversely, the sharp intraday rebound on Wednesday afternoon may have opened a bullish FVG below price that could act as a magnet if the market needs to rebalance.

Mid‑week rejection lows often define powerful bullish order blocks for future retests.
Thursday June 11, 2026 – Strong Reversal: Buyers Take Control
Thursday delivered the reversal confirmation. SPY ripped back to close at 737.76, nearly reclaiming all of Tuesday’s losses and erasing much of Wednesday’s drop. Volume remained high (~86M), underscoring strong participation on the buy side. This day likely printed a wide‑range bullish candle closing near its high—potentially the first bar of a bullish engulfing pattern when viewed alongside Wednesday’s candle.
Candle pattern: Strong bullish body, likely taking out Wednesday’s high or closing above its midpoint—classic confirmation of a daily swing low.
Fair value gaps: The speed of Thursday’s move likely created a bullish FVG beneath price on the 1‑hour or 4‑hour chart. Mark that gap as an important retest zone for dip‑buyers next week if price pulls back toward 730–735.
Bullish order block: The last small bearish candle on the lower timeframes before Thursday’s impulsive leg higher can be treated as a bullish intraday order block. This is where institutions likely initiated or added to longs.
Friday June 12, 2026 – Break and Hold Above the Weekly Open
Friday extended the upside, closing at 741.75, above Monday’s 739.22. While volume eased to ~57M, the market still showed a clear willingness to accept higher prices. The daily candle likely formed a bullish continuation bar—possibly with a modest upper wick as price probed liquidity above the week’s prior highs.
Candle pattern: Potential follow‑through bar after Thursday’s reversal, completing a three‑bar swing low pattern (Wed–Thu–Fri). Together, these three sessions form a W‑shaped bottom on lower timeframes inside the broader weekly U‑turn.
Fair value gaps: Any quick breakout above Thursday’s high may have left a small upside FVG that price could revisit early next week before deciding on the next impulse leg.
Order blocks and liquidity: Friday likely raided liquidity resting above short‑term highs. Watch for a small bearish intraday order block near Friday’s high; if price revisits it and rejects, that could signal a short‑term pause before any further advance.
💡 Pro Tip: For your weekly prep, screenshot the daily chart and mark: (1) Wednesday’s low as your swing reference, (2) Thursday’s bullish FVG below price, and (3) Friday’s high and any small intraday bearish order block as your immediate resistance band.
Mapping the Key Levels: Fair Value Gaps and Order Blocks to Watch
While precise intraday levels require your own chart, you can build a practical map for the coming week using last week’s structure:
Weekly bullish order block (support zone): Around the 725–730 region, defined by Wednesday’s rejection low and the last down candle before Thursday’s rally. This is your primary downside reference for dip‑buying, as long as the broader trend remains intact.
Thursday bullish FVG (retest zone): Roughly in the 730–735 band on intraday charts. A controlled pullback into this gap early next week, followed by bullish reaction, would align with continuation higher.
Friday’s high / short‑term liquidity pocket: The area just above 741.75. If price trades above and holds, it opens the door for a push toward new highs. If it wicks above and closes back below, that could mark a short‑term distribution zone.
Price Action Outlook: SPY Trading Scenarios for June 15–19, 2026
Based on last week’s U‑shaped recovery and the likely weekly bullish rejection candle, the path of least resistance into the new week is cautiously higher, as long as key supports hold. Here are three practical scenarios to anchor your plan:
Base Case – Bullish Continuation from a Shallow Pullback
SPY opens the week near Friday’s close and pulls back modestly into the 735–738 area, potentially tagging part of Thursday’s FVG. If buyers defend that zone and price reclaims Friday’s high, the market can extend higher, targeting new liquidity above recent swing highs. For swing traders, this supports a buy‑the‑dip bias above 730 with tight risk defined below the bullish order block.Alternative – Deeper Mean Reversion into the Weekly Order Block
A more volatile open could drive SPY back toward the 725–730 weekly bullish order block. If price trades into that zone and leaves lower‑timeframe reversal patterns (hammer candles, bullish engulfing, or liquidity sweeps followed by closes back above), this can provide high‑reward long entries for traders willing to sit through some chop.Risk Scenario – Failed Low and Trend Shift
If SPY breaks decisively below 725 and cannot reclaim that level on a daily closing basis, the prior week’s bullish order block fails. That would shift the tone toward distribution and open downside toward older liquidity pools below recent swing lows. In this case, short setups around failed retests of 725–730 become more attractive for active traders.
📌 Trading Plan Prompt: Before Monday’s open, decide which scenario you will favor, what price action would confirm it, and where your invalidation line sits. Write it down and let the chart prove you right or wrong.
Moon Phases and Market Mood: June 15 - 19
Monday, June 15, 2026 – New Moon: Gemini
Focus of Energy: The week opens under a Super New Moon (Amavasya) in Gemini, which forms a tight conjunction with Mercury. This cosmic meeting creates a harmonious balance between emotional feelings and logical reason. In traditional astrology, this invisible moon is associated with introspection, slowing down, and conserving emotional energy. It is highly recommended to avoid rushing into significant financial commitments, major purchases, or large investments during this time. Instead, use this day to quietly review your trading goals, evaluate your plans, and tie up loose ends before the new cycle unfolds.
Tuesday, June 16, 2026 – Waxing Crescent: Gemini
Focus of Energy: The moon enters its Waxing Crescent phase, forming a beautiful, elongated triangle with Jupiter and Mercury in the evening sky. As the first sliver of moonlight returns, the energetic tone shifts away from inward reflection toward building fresh thoughts, learning, and exploring new connections. For market participants, this is a prime time to organize ideas, map out upcoming setups, and set fresh money goals as new opportunities begin to stir.
Wednesday, June 17, 2026 – Waxing Crescent: Cancer
Focus of Energy: Maintaining its Waxing Crescent trajectory, the Moon crosses the Beehive star cluster (M44) in central Cancer. On this day, the Moon will undergo a rare daytime occultation of Venus, briefly passing directly in front of the planet. Because this unique celestial event occurs during daylight hours, skywatchers and market observers must exercise extra caution and awareness when scanning the horizon.
Thursday, June 18, 2026 – Waxing Crescent: Leo
Focus of Energy: As the Waxing Crescent builds further, the Moon lines up elegantly with Venus, Jupiter, and Mercury in the western sky after sunset. It positions itself near Regulus, the brightest star in the constellation of Leo. This period brings a quiet pull toward fresh beginnings, inspiring individuals to act with more confidence and take the lead on their goals. Traders can leverage this proactive momentum to refresh long-term goals and move their plans in a promising direction.
Friday, June 19, 2026 – Waxing Crescent: Virgo
Focus of Energy: The week concludes with the Waxing Crescent moon moving into Virgo. This celestial positioning introduces a strong desire for order, analytical thinking, and practical solutions. A highly pragmatic and detail-oriented mood encourages individuals to navigate daily challenges effectively. It serves as a perfect time for traders to manage mundane affairs, clear up any distractions, and ensure everything is thoroughly structured before moving forward.
💡 How to Use This Lunar Guide: Do not trade solely on moon phases. Instead, use them as a context layer on top of your technicals: lean more aggressive on entries during constructive waxing phases, and more defensive around Full Moons and into the waning portion of the cycle.
Bringing It All Together: Your Weekly SPY Trading Checklist
To turn this overview into a practical weekly resource, here is a concise checklist you can run through before Monday’s open and each morning of the June 15–19 week:
1. Mark your levels: Plot Wednesday’s low (~725), Thursday’s FVG (~730–735 zone), and Friday’s close/high (~741.75 and above). Note the weekly bullish order block near 725–730.
2. Define your bias: As long as SPY holds above the 725–730 order block, favor buy‑the‑dip setups into FVGs and prior highs. A clean break and close below that zone shifts you to a more defensive or short‑biased stance.
3. Align with the lunar rhythm: Use waxing gibbous days (Mon–Tue) for refined entries, mid‑week for careful observation and potential reversals, and the Full Moon Friday for position management and risk control.
4. Pre‑plan scenarios: Write out your bullish, neutral, and bearish paths for SPY, including what price action would confirm each and where you will not trade (your “no‑touch” zones).
5. Review and adapt: At the end of each session, quickly note what actually happened versus your plan. Over time, this feedback loop sharpens your edge far more than any single indicator.
Last week’s SPY action—flush, reject, and recover—reminds traders that liquidity hunts and order blocks often matter more than headlines. Combine that structural awareness with a simple lunar rhythm overlay, and you have a grounded, repeatable framework to approach each new trading week with clarity instead of noise.
