SPY Weekly Outlook: Fibonacci, Liquidity & Lunar Trends
Markets, SPY Weekly Outlook, Astro-Finance
SPY Weekly Outlook: Doji at 1.382 Fib, Liquidity Below, and Lunar Winds Ahead
A balanced look at SPY’s weekly chart, key Fibonacci levels, liquidity zones, and how next week’s moon phases may color market sentiment from Monday, May 4, 2026, through Friday, May 8, 2026.

Global Market Backdrop: A Rally Testing Its Nerves
Global equities head into the week of May 4–8, 2026 with a distinctly bullish but increasingly cautious tone. In the United States, the S&P 500 has just logged its fifth straight winning week and closed at fresh all‑time highs, powered by heavyweight earnings from Apple and Alphabet, which surprised to the upside and helped push major indices to record territory. SPY, the popular ETF tracking the S&P 500, is trading above $720, consolidating after tagging an intraday high near $724.80 on Friday May 1, 2026.
Beneath the surface, however, the picture is more nuanced. Market breadth has narrowed, with barely over half of S&P 500 components trading above their 50‑day moving averages, a reminder that mega‑caps are doing much of the heavy lifting. Oil prices have swung sharply on U.S.–Iran tensions before easing, and inflation remains stubborn, with the Fed’s preferred gauge running at 3.5% year‑over‑year and policymakers keeping rates on hold at 3.50%–3.75% while signaling a cautious stance. Against this backdrop, SPY’s weekly chart is sending a message of its own: strong trend, but at a critical decision point.
Weekly SPY Snapshot: Another Doji at a Key Fibonacci Extension
From a weekly chart perspective, SPY continues to trade in a powerful uptrend, having broken out above prior resistance in the low $710s and now hovering in the low $720s. Last week’s candle printed as another weekly doji—a pattern characterized by a relatively small real body and wicks on either side, signaling a tug‑of‑war between buyers and sellers after a strong advance. In trending markets, dojis at new highs often mark indecision rather than immediate reversal, but they do warn that momentum is being questioned.
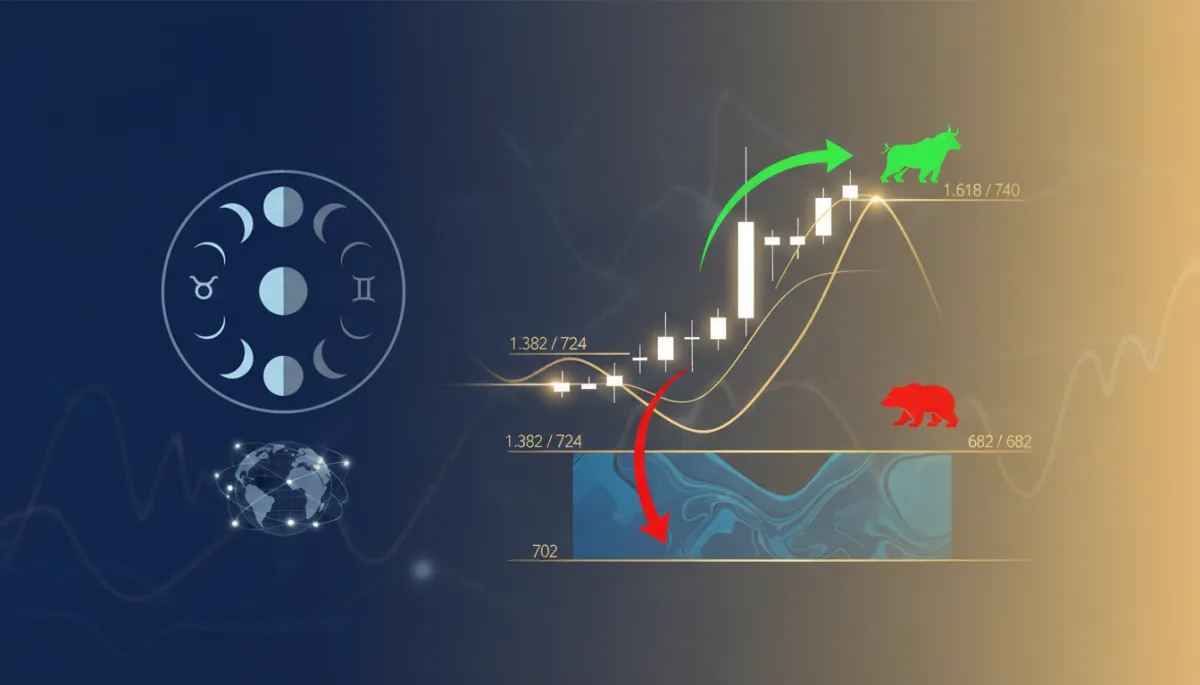
Importantly, this latest doji formed while SPY was testing the 1.382 Fibonacci extension of the prior major swing, aligning around the $724–$725 zone. For this analysis, we treat the 1.382 extension as approximately $724, a level that price briefly pierced intraday before settling back below. That confluence—new highs, a mature weekly trend, and a doji candlestick right at a Fibonacci extension—sets the stage for a classic “inflection‑point” week ahead.

SPY’s weekly doji at a Fibonacci extension often precedes either trend continuation or a sharp liquidity hunt.
Bullish Outlook: Path Toward the 1.618 Fibonacci Extension at 740
From a bullish standpoint, the current consolidation above $720 can be read as a healthy pause within a dominant uptrend. As long as SPY holds above last week’s midpoint and, more broadly, above the $710–$715 support band that has underpinned the rally, buyers retain control. Earnings momentum from mega‑caps, easing oil prices, and the Fed’s decision to stay on hold all support the case for risk assets to grind higher if data cooperate.
In Fibonacci terms, if SPY can decisively absorb supply at the 1.382 extension near $724 and convert that region into support, the next logical upside target becomes the 1.618 extension, projected around the $740 price level. A weekly close above the 1.382 zone, ideally with a stronger body than last week’s doji and expanding volume, would add conviction to a continuation scenario toward $740. In that case, traders may look for:
Intraday dips toward $715–$720 to be bought quickly, leaving higher lows on the daily chart.
Rotation into lagging sectors, helping broaden market breadth rather than relying solely on tech leaders.
A benign read on key macro data (such as labor and inflation releases) that keeps the Fed in “wait‑and‑see” mode.
📌 Key Takeaway: Above the 1.382 extension, the $740 region aligned with the 1.618 Fibonacci level becomes a credible upside magnet for trend followers, as long as weekly structure remains intact.
Bearish Pullback Potential: Liquidity Hunt Into the 702–682 Fair Value Gap
The alternative path is a classic liquidity‑seeking pullback. Last week’s doji at a major extension level suggests that, while buyers remain in control, they are no longer driving price higher with the same urgency. If sellers manage to push SPY below short‑term supports, price could be drawn toward the fair value gap (FVG) that sits roughly between $702 and $682 on the higher‑timeframe chart.
This FVG represents an area where price previously moved so quickly that it left behind relatively “thin” trading, with untested liquidity. In many modern trading frameworks, these gaps are viewed as zones that price often revisits to “rebalance” order flow. A move into $702–$682 would therefore not necessarily mean the end of the bull trend; instead, it could be a deeper reset within it. In a bearish‑then‑bullish scenario, traders might watch for:
A break below $710–$712 that accelerates toward the upper edge of the FVG near $702.
Responsive buying inside the $702–$682 band, signaled by long lower wicks, bullish reversal candles, or expanding volume on up‑days.
The gap acting as a new structural support, from which SPY can build a base and attempt another leg higher toward the $724 and eventually $740 regions.
⚠️ Risk Note: A sustained weekly close below the lower FVG boundary near $682 would weaken the bullish thesis and raise the odds of a more significant trend change, particularly if accompanied by deteriorating macro data or a hawkish shift from the Fed.
Moon Phases, Signs, and Energies: May 4–8, 2026
For traders who blend traditional technicals with astro‑finance, the upcoming week also carries an interesting lunar backdrop. While astrology is not a substitute for risk management or robust analysis, some market participants use it as a secondary lens to frame sentiment and timing. Here is a high‑level, non‑predictive overview of the moon’s journey and the themes it may symbolically highlight between Monday, May 4, and Friday, May 8, 2026.
Monday, May 4: Waning Gibbous in Sagittarius – Release, Expansion, and Mental Decluttering
The week opens with the moon in a waning gibbous phase in Sagittarius (around 93% illumination), a mutable fire sign associated with expansion, belief systems, and big‑picture thinking. Waning gibbous energy emphasizes release and integration after a peak—you’re processing what’s already happened and clearing space before the Last Quarter phase. For Monday’s session, the focus leans toward:
Letting go of outdated beliefs about the market or your strategy—releasing narratives that no longer fit SPY’s current structure around the 1.382 Fib near $724 and making room for more objective, data‑driven views.
Clearing mental and workflow clutter—finishing lingering tasks, closing stale positions, and preparing your playbook for the coming shift in the lunar cycle.
Tuesday–Wednesday, May 5–6: Waning Gibbous in Sagittarius & Capricorn – Grounding, Organization, and Structured Release
On Tuesday, May 5, the moon continues its waning gibbous phase in Sagittarius before shifting into Capricorn in the evening, beginning a more grounded, task‑oriented stretch that carries into Wednesday, May 6 with the moon fully in Capricorn. Capricorn, a cardinal earth sign, is linked to structure, discipline, and long‑term goals. This blend supports:
Using Tuesday’s transition to ground big ideas into practical plans—reflecting on your broader objectives, then organizing your SPY watchlist and levels so your workspace and charts feel decluttered and intentional.
Leaning into Wednesday’s Capricorn energy for structured release and accountability—finalizing obligations, tightening risk parameters, and consciously letting go of habits that undermine your long‑term performance in zones like $715–$720.
Thursday–Friday, May 7–8: Waning Gibbous in Capricorn & Aquarius – Revising Plans, Reflection, and Social Release
On Thursday, May 7, the waning gibbous moon remains in Capricorn, supporting continued revision and pragmatic cleanup—a good backdrop for organizing plans, closing out projects, and releasing unnecessary stress. By Friday, May 8, the moon shifts into Aquarius (with illumination drifting toward the 60–70% range), an air sign associated with community, innovation, and detachment. Together, these days can highlight:
Continuing to revise and tidy trading plans on Thursday—taking a pragmatic look at open SPY positions, tightening processes, and making sure your approach to zones like $702–$682 aligns with your real risk tolerance.
Using Friday’s Aquarius tone for reflection and social release—stepping back to examine how your views are shaped by crowd sentiment, communities, or social feeds, and consciously releasing limiting perspectives that keep you from seeing SPY’s range and liquidity dynamics objectively.
💡 Perspective: If you incorporate lunar or astrological cycles, use them as a context tool—a way to frame potential mood shifts—while still basing entries, exits, and risk controls on objective price action and clearly defined levels.
Bringing It All Together for the Week Ahead
SPY enters the new trading week perched near record highs, shaped by a weekly doji at the 1.382 Fibonacci extension around $724, a still‑bullish macro backdrop, but also growing signs of fatigue in breadth and sentiment. The bullish roadmap envisions a clean break above this extension, opening a path toward the 1.618 Fib target near $740. The bearish‑yet‑constructive alternative sees SPY dipping into the $702–$682 fair value gap to harvest resting liquidity, build a sturdier support base, and then attempt another drive higher.
Layered over this technical structure, the week’s moon phases and sign shifts symbolically highlight a journey from practicality, through heightened information flow, to deeper emotional reflection. Whether you view those cycles as metaphor or signal, the core message is the same: stay flexible, respect your levels, and let the market show its hand around this pivotal zone. For SPY traders, the coming days are less about predicting the next move and more about preparing clear plans for both a breakout toward $740 and a liquidity‑seeking detour into the $702–$682 region.
However you blend fundamentals, technicals, and astro‑finance, this is a week to stay engaged, but not overexposed—letting the interplay of global news, key Fibonacci levels, and investor psychology define the next chapter of SPY’s remarkable run.
