

SPY Sweeps the Lows, Gaps Higher on Jobs & Heads Into Fed-Minutes Week
SPY Weekly Recap: September 28–October 2, 2026 | Outlook: October 5–9, 2026
Presented by The Trader’s Crib!®
Last week gave us one of those charts that looks confusing until you stop trying to predict it and simply follow the candles.
SPY entered Monday under pressure, spent most of the week grinding lower, completed the remaining portion of a bullish fair value gap that had been sitting beneath price, swept below multiple short-term lows on Thursday, and then exploded higher Friday morning after a much softer-than-expected U.S. employment report changed the conversation around the Federal Reserve.
And yet Friday's candle itself closed below its opening price.
That is the kind of detail we love here at The Trader's Crib!® because it reminds us that a “green market day” and a “green candle” are not always the same thing.
By Friday's closing bell, SPY had:
fully mitigated the bullish daily FVG below,
fully mitigated the bearish daily FVG above,
created a fresh traditional price gap underneath Friday,
recovered most of the week's losses,
and left traders with a very clean decision map heading into October 5–9.
The Moon is giving us an equally interesting transition.
We are moving through the final days of Krishna Paksha, the waning half of the lunar cycle. The Moon will shrink from roughly 28% illumination Monday to barely 1% Friday, moving through sidereal Cancer, Leo and Virgo before Saturday's New Moon. Time and Date
For the woman trading while simultaneously managing work, business, family, relationships, responsibilities, healing, ambition—and sometimes everybody else's needs too—the message this week is beautifully simple:
You do not need more stimulation.
You need cleaner energy.
Let's get into the chart.
SPY Weekly Snapshot
September 28–October 2, 2026
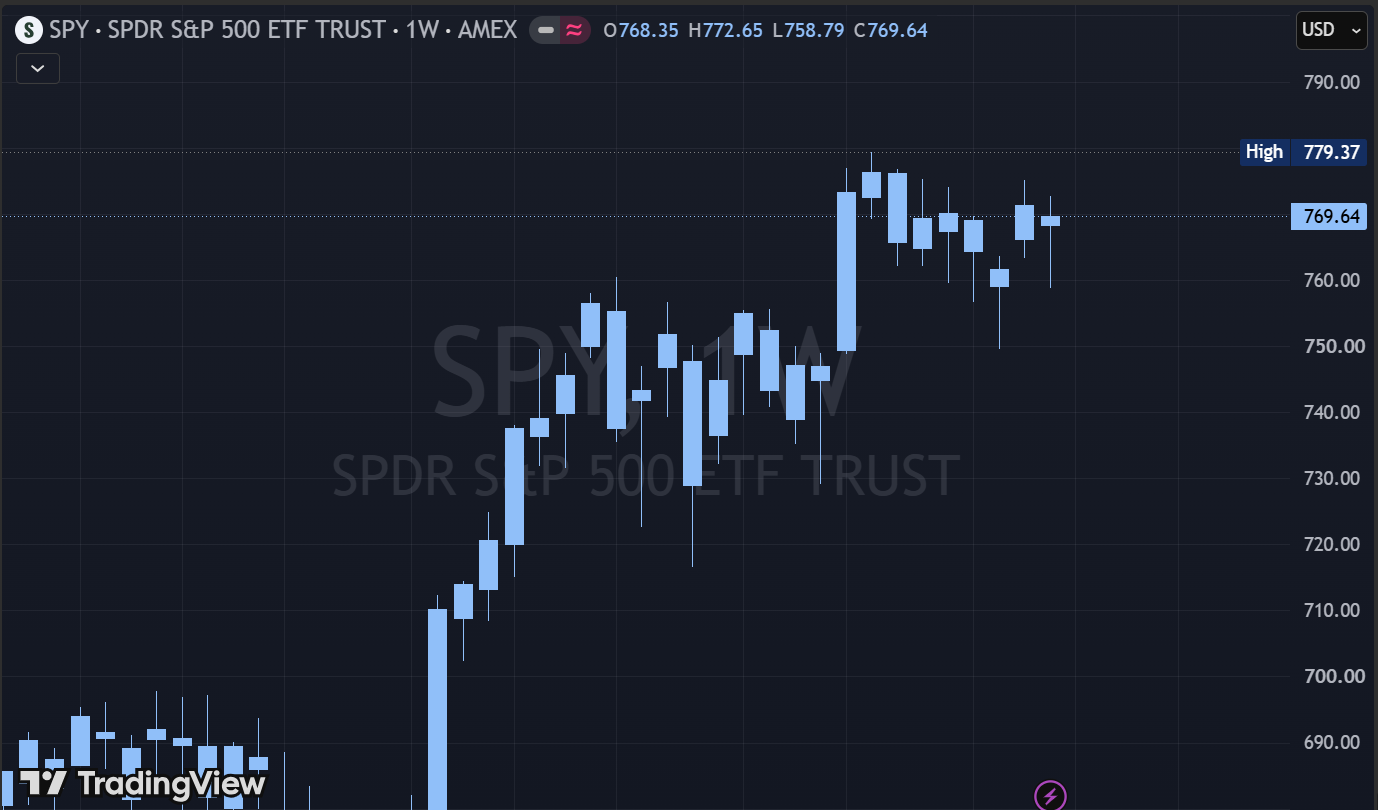
SPY printed the following regular-session OHLC values:
The historical session data show a weekly open of $768.35, high of $772.65, low of $758.79 and Friday close of $769.64. StatMuse
That gives us:
There is an important distinction here.
SPY closed $1.29 above Monday's opening price, so the weekly candle itself has a small bullish real body.
But the previous Friday had closed at $771.35, meaning SPY actually finished the week approximately 0.22% lower on a close-to-close basis. StatMuse
So visually?
Bullish-bodied weekly candle.
Performance-wise?
Slightly negative week.
That is why understanding what a candle actually represents matters.
What the Weekly Candle Is Telling Us
The weekly candle may be small in the body, but the wicks tell the larger story.
SPY opened at $768.35 and eventually fell to $758.79
That is a lower excursion of approximately $9.56 beneath the weekly open.
Yet SPY ultimately recovered to close at $769.64
—more than $10 off the weekly low.
There was also an upper wick, because Friday reached $772.65 before settling lower.
So I would describe this as a bullish-bodied weekly rejection candle with a dominant
lower wick rather than a textbook hammer.
The message?
Sellers controlled a large portion of the week.
But when they finally pushed beneath the obvious lows, buyers responded aggressively.
That creates an important question for October 5: Was $758.79 simply a temporary
liquidity sweep before another push higher? Or Was Friday's gap-up recovery only a relief
move inside a larger range?
We don't have to guess.
We already know which levels will answer that question.
The Fair Value Gap Story
This Week Was About Completion
Interestingly, September 28–October 2 did not create a new textbook daily fair value gap.
Each three-candle sequence contained enough overlap between Candle 1 and Candle 3
that no completely fresh daily FVG was left behind.
Instead, this week did something arguably more useful for our education:
It finished the imbalances from the previous week.
Let's walk through both.
The Bullish Daily FVG Is Finally Complete
Last week's powerful Monday displacement created a bullish daily FVG between:
$762.00 – $772.57
By the end of September 25, most of that imbalance had already been traded through.
Only approximately:
$762.00 –$ 763.25 remained unfinished.
Then this week arrived.
Tuesday, September 29 traded down to $762.35
That left only about $762.00–$762.35 unfinished.
Wednesday pushed even deeper $762.18
Now just $0.18 remained between price and complete mitigation.
Then Thursday finished it.
SPY fell to $758.79 which traded completely through the $762.00 lower boundary.
The bullish daily fair value gap was therefore FULLY MITIGATED THURSDAY.
And here's where it gets interesting.
Price did not merely touch the old FVG boundary.
It went through it.
Then reversed.
That gives Thursday's candle much more significance.
The Bearish Daily FVG Is Finished Too
Above price, we had the opposite problem.
The previous week created a bearish daily FVG between $768.95–$772.57
Friday September 25 had already traded as high as $772.28, leaving only $772.28–
$772.57 unfinished.
For most of this week, that upper portion remained untouched.
Monday, September 28
Sellers Start the Week With a Gap Down
Open: $768.35 High: $769.54 Low: $763.72 Close: $765.61
The previous Friday had closed at $771.35
Monday opened at $768.35
That created an opening gap of approximately $3.00 lower
But there is an important distinction.
Friday's previous low was $766.29, and Monday traded as high as $769.54.
So the two daily ranges overlapped.
This was an opening gap relative to Friday's close—not a completely separated range gap.
Monday attempted to recover toward $770 but failed.
Price eventually dropped to $763.72 and closed at $765.61.
The candle was bearish, with wicks on both ends, but the close remained well above the day's extreme low.
The broader market was dealing with an uncomfortable combination of rising Treasury yields, high oil prices and renewed uncertainty around U.S.-Iran negotiations. The S&P 500 fell roughly 0.8% as bond yields pushed higher. Reuters
Technically, Monday told us:
Friday's recovery was being challenged.
But we still had not reached the lower unfinished FVG.
That job belonged to Tuesday.
Tuesday, September 29
Price Goes Hunting for the Bullish FVG
Open: $766.83 High: $766.98 Low: $762.35 Close: $764.20
Tuesday actually opened $1.22 above Monday's close.
But the opening strength failed almost immediately.
SPY managed only $766.98 before sellers drove price to $762.35
Remember that unfinished bullish FVG?
$762.00–$763.25
Tuesday traded almost completely through it.
The day's candle was bearish with a tiny upper wick and a larger lower wick.
That tells us sellers controlled the direction early, but buyers did begin responding near the lows.
Macro pressure remained heavy as long-term Treasury yields climbed to multi-decade highs. The 10-year Treasury yield reached around 5.29%, while consumer confidence dropped sharply and investors continued weighing inflation risks from elevated energy prices. Reuters
Tuesday's lesson:
Price was clearly drawn toward unfinished business.
And when an imbalance is only pennies away from being filled?
Assuming it “has to hold” can be dangerous.
Wednesday proved that point.
Wednesday, September 30
The Gap-Up Attempt Fails
Open: $766.45 High: $769.41 Low: $762.18 Close: $762.63
Wednesday opened $2.25 above Tuesday's close.
For a moment, that looked constructive.
SPY pushed as high as $769.41
But buyers could not hold the advance.
By the closing bell, SPY had dropped all the way to:
$762.63 with an intraday low of $762.18
That left only eighteen cents of the old bullish FVG unfinished.
Wednesday's candle is especially educational because it had:
a large bearish body,
a meaningful upper wick,
and a close very near the low.
That is not what strong bullish acceptance looks like.
The macro backdrop was mixed. August PCE inflation came in cooler than economists expected, reducing some fear of an immediate Fed hike, while second-quarter GDP remained solid. Still, the S&P 500 finished modestly lower as investors continued wrestling with elevated yields and energy prices. Kitco
This is a perfect example of why:
Good news does not automatically equal a bullish candle.
The market had positive inflation information.
The chart still closed weak.
Price gets the final vote.
Thursday, October 1
The Sweep Beneath the Lows
Open: $764.36 High: $765.65 Low: $758.79 Close: $763.99
Thursday is arguably the most important technical candle of the entire week.
SPY opened higher again.
Then it dropped.
First beneath Tuesday's $762.35 low.
Then beneath Wednesday's $762.18 low.
Then beneath the bullish FVG floor at $762.00.
And eventually all the way to $758.79
That move completely filled the bullish daily FVG.
But instead of closing at the low, SPY recovered.
The session finished at $763.99
That created a candle with an extremely small real body and a very long lower wick.
This is what traders often describe as a liquidity sweep:
Price moves beneath an obvious cluster of recent lows, trades through the liquidity sitting underneath them, and then reclaims the area.
We don't need to invent a story about who deliberately caused the move.
The candles tell us what actually happened:
Tuesday low broke.
Wednesday low broke.
$762 broke.
Price reached $758.79.
Then SPY closed back above $762.
That is observable.
Thursday's macro environment was just as volatile. The 10-year Treasury yield briefly reached roughly 5.34%, its highest level since 2002, as strong economic data and elevated manufacturing input prices fueled inflation concerns. Equities later recovered as yields retreated and Fed officials struck a more patient tone. Reuters
So by Thursday's close, we finally had something important:
Lower prices were rejected.
Friday would test whether buyers could follow through.
Friday, October 2
The Jobs Report Changes the Conversation
Open: $770.58 High: $772.65 Low: $767.15 Close: $769.64
Friday arrived with a completely different tone.
September nonfarm payrolls increased by just 29,000 jobs versus expectations around
90,000.
The unemployment rate rose to 4.2%, while August payroll growth was revised lower.
The softer labor data reduced expectations that the Federal Reserve would raise rates again at its October meeting, sending stocks higher and Treasury yields lower after the report. Investing.com
And SPY responded immediately.
Thursday closed $763.99
Friday opened at $770.58
That is a huge $6.59 opening gap higher.
More importantly, Thursday's entire high was $765.65
and Friday's low never fell below $767.15
That leaves a genuine range gap between $765.65–$767.15
That gap remained completely open at Friday's close.
This is now one of the most important structures to carry into next week.
Friday Was a Green Day — But a Red Candle
This is a concept worth slowing down for.
Friday's Thursday-to-Friday close change was positive:
Thursday close: $763.99
Friday close: $769.64
So SPY gained approximately +0.74% for the day.
But Friday opened at $770.58 and closed at $769.64
That means the daily candle body itself was bearish.
So SPY had a green market day with a red daily candle.
Why?
Because percentage performance is usually measured from the previous day's close.
Candlestick color compares the current day's open to its close.
That distinction matters.
Friday's candle showed that investors enthusiastically repriced SPY higher before the regular session, but once regular trading began, price did not continue straight upward.
SPY reached $772.65, but sellers brought it back below its opening price.
That does not invalidate the bullish gap.
But it tells us the $772 area is still contested.
The Gap Story Going Into Next Week
After all that FVG mitigation, our cleanest unfinished structure is no longer a fair value gap.
It is Friday's traditional price gap.
Thursday high $765.65
Friday low $767.15
That leaves range gap: $765.65–$767.15
And because Thursday closed at $763.99, the broader close-to-open gap was even larger.
Friday filled part of that opening gap intraday but did not return anywhere close to Thursday's close.
So next week presents a simple question:
Does SPY hold above Friday's gap?
Or:
Does price come back to rebalance the move?
Neither answer is inherently bullish or bearish.
What happens after price reaches the gap matters more than the gap itself.
SPY Outlook
October 5–9, 2026
Next week's calendar is lighter than last week's employment-and-PCE combination, but there are still several events that could move yields and SPY.
Monday brings ISM Services at 10:00 AM ET. Tuesday includes the U.S. trade balance at 8:30 AM. Wednesday brings the September 15–16 FOMC minutes at 2:00 PM ET. Thursday includes weekly jobless claims at 8:30 AM, and Friday brings the preliminary University of Michigan consumer survey at 10:00 AM. Federal Reserve Bank of New York
The Fed backdrop has also shifted. After Friday's weak payroll report, market expectations moved toward the Fed pausing at its late-October meeting, although persistent inflation remains a reason policymakers may stay cautious. Reuters
And bond yields are still elevated enough that they matter.
So this remains an environment where:
SPY can react as much to yields as to the headline itself.
🟢 Bullish Perspective

🔴 Bearish Perspective

The Trader's Crib!® SPY Map
The quick version:
Above $772.65 → bulls challenge $775.14.
Above $775.14 → $779 comes back into play.
Below $767.15 → Friday's gap starts filling.
Below $765.65 → watch $764, then $762.
Below $762 → $758.79 becomes vulnerable again.
That's our map.
No prediction required.

October 5–9, 2026
Now we move from price structure to mental structure.
And this week's lunar cycle is very different from last week's.
The Third Quarter occurred Saturday, October 3.
By Monday, the Moon is already a thin waning crescent, approximately 28.4% illuminated.
From there:
Monday: ~28.4%
Tuesday: ~18.6%
Wednesday: ~10.5%
Thursday: ~4.7%
Friday: ~1.2%
The exact astronomical New Moon arrives Saturday, October 10 at approximately 11:50 AM Eastern Time in New York. Time and Date
This means the entire trading week occurs during the final days of: Krishna Paksha
—the waning lunar half.
Symbolically, this is not expansion energy.
It's reduction.
Closure.
Discernment.
Quiet.
Releasing what has become unnecessary.
And for a woman who spends so much of her life holding things together?
That theme deserves attention.
Because sometimes the answer isn't:
“How can I do more?”
Sometimes the better question is:
“What can I stop carrying?”

This Week's Sidereal Moon Journey
Using the Lahiri ayanamsa for New York, the Moon's path is:
Monday — Cancer
Tuesday — Cancer → Leo around 12:48 PM ET
Wednesday — Leo
Thursday — Leo during market hours → Virgo around 5:48 PM ET
Friday — Virgo
Horalabs calculates these positions for New York using the Lahiri ayanamsa. Monday is in Cancer, Tuesday transitions from Cancer to Leo at approximately 12:47:50 PM, Wednesday remains in Leo, Thursday transitions into Virgo after the closing bell at approximately 5:48 PM, and Friday remains in Virgo. Horalabs
Let's translate that into something useful for the trader behind the chart.
Monday, October 5
Waning Crescent Moon in Cancer — Karka
The sidereal Moon spends Monday in Cancer.
Monday begins in Krishna Dashami, moving into Ekadashi around 4:38 PM Eastern—after the regular trading session. Horalabs
Cancer is traditionally ruled by the Moon itself.
Its themes include:
emotional awareness,
security,
care,
protection,
intuition,
home,
inner stability.
And the Moon is now only about 28% illuminated
Energy of Focus: Protect Your Emotional Bandwidth
Monday is not asking you to become emotionless.
Female traders do not need to imitate some fantasy of the robotic trader who feels nothing.
The goal is awareness.
Ask: What am I carrying into the market this morning?
Did you wake up worried about work?
Are you frustrated with someone?
Did you sleep poorly?
Are you already overwhelmed before the opening bell?
Those things matter—not because they predict SPY, but because they influence you.
Cancer symbolism reminds us to create emotional boundaries.
Your market session does not need access to every emotion you experienced before 9:30.
Monday's mantra:
"I can acknowledge what I feel without letting it manage my trade."
Tuesday, October 6
Cancer → Leo During the Trading Session
Tuesday begins with the sidereal Moon still in Cancer.
Then at approximately 12:48 PM ET the Moon enters Leo — Simha. Horalabs
The day also begins in Krishna Ekadashi before transitioning into Dwadashi at approximately 3:05 PM.
Moon illumination falls to approximately 18.6%
This creates an interesting symbolic transition.
Cancer asks:
“Do I feel safe?”
Leo asks:
“Do I trust myself?”
Those are not the same question.
Energy of Focus: From Reassurance to Self-Trust
One of the easiest traps in trading is constantly searching for confirmation from other people.
You mark a setup.
Then you open X.
Then YouTube.
Then Discord.
Then somebody else's chart.
Then one person says bullish.
Another says bearish.
Now the setup you understood five minutes ago suddenly feels confusing.
Tuesday's afternoon Leo transition offers a useful challenge:
Trust the work you already did.
That doesn't mean becoming stubborn.
It means distinguishing between useful information and reassurance-seeking.
Tuesday's mantra:
"My plan does not need a committee."
Wednesday, October 7
Waning Crescent Moon in Leo
Wednesday keeps the sidereal Moon in Leo throughout regular market hours.
The day begins in Krishna Dwadashi and transitions into Trayodashi at approximately 1:47 PM ET. Horalabs
And at 2:00 PM ET the Federal Reserve releases the minutes from its September 15–16
meeting. Federal Reserve
Moon illumination is only about 10.5%
Energy of Focus: Confidence Without Proving
Leo can symbolize healthy confidence.
But the shadow side of confidence is ego.
And trading will expose that difference very quickly.
A confident trader says:
“This is my setup. This is my risk. If I'm wrong, I'm out.”
An ego-driven trader says:
“I know I'm right. The market just hasn't realized it yet.”
With Fed minutes arriving at 2 PM, Wednesday may provide exactly the kind of volatility that tempts traders to prove themselves.
Do not turn a headline candle into a referendum on your intelligence.
Do not revenge trade because the first reaction stopped you out.
Do not increase size because you missed the first move.
Wednesday's mantra:
"Confidence follows my process—not my P&L."
Thursday, October 8
Moon in Leo During Market Hours
Thursday keeps the Moon in sidereal Leo for the entire regular trading session.
The transition into Virgo does not occur until approximately 5:48 PM ET
after the closing bell. Horalabs
The Moon is now only 4.7% illuminated
Krishna Trayodashi transitions into Chaturdashi around 12:47 PM.
Energy of Focus: Lead Yourself
Being disciplined is easy when everything is going according to plan.
Leadership shows up when it isn't.
You missed the trade.
Can you leave it alone?
You took a loss.
Can you avoid revenge trading?
You made money.
Can you stop before overconfidence gives it back?
You're exhausted.
Can you admit that today may not be your day?
For women who spend their lives leading teams, households, businesses, families and communities, we sometimes forget:
You also have to lead yourself.
Leadership is not forcing yourself to perform.
Sometimes leadership is telling yourself:
“We're done for today.”
Thursday's mantra:
"Self-control is part of self-leadership."
Friday, October 9
Waning Crescent Moon in Virgo — Kanya
By Friday morning, the Moon is firmly in sidereal Virgo — Kanya and only approximately
1.2% illuminated
Friday begins in Krishna Chaturdashi.
Then at approximately 12:07 PM ET the Amavasya tithi begins.
The exact astronomical New Moon follows Saturday at approximately 11:50 AM ET. Horalabs
Virgo is traditionally ruled by Mercury.
Its themes include:
discernment,
organization,
analysis,
refinement,
routines,
detail,
service.
Which makes Friday's mindset theme almost perfect.
Energy of Focus: Clean the System
Before beginning another week, ask:
What in my trading process is creating unnecessary friction?
Too many levels?
Too many indicators?
Too many accounts?
Too many trades?
Too many opinions?
Too many screenshots you never review?
Too many notifications?
Virgo doesn't need chaos to feel productive.
It refines.
And as the lunar cycle reaches almost complete darkness?
This is an excellent symbolic moment to close loops.
Review your journal.
Organize screenshots.
Calculate performance.
Identify one habit to keep.
Identify one habit to stop.
Then let the trading week end.
Friday's mantra:
"A cleaner process creates a quieter mind."
The Moon's Trading-Week Rhythm
*The New Moon arrives: Saturday, October 10 ~11:50 AM ET
Where the Market and Moon Meet This Week
There is a fitting parallel between the technical chart and the lunar cycle.
Last week SPY completed old imbalances.
The bullish FVG below?
Filled.
The bearish FVG above?
Filled.
The market effectively cleared old technical business.
And now the lunar cycle is doing something symbolically similar.
The visible Moon is disappearing.
By Friday, almost nothing remains illuminated.
The theme in both places is:
Clear the old before building the new.
Again, the Moon isn't telling us where SPY will go.
The value is in reflection.
What old trading behavior keeps taking up space?
Maybe it's revenge trading.
Maybe it's FOMO.
Maybe it's entering too early.
Maybe it's staying in losing trades because closing them feels like failure.
Maybe it's checking your P&L twenty times per hour.
Maybe it's comparing your trading journey to a woman online who appears to have everything figured out.
Release it.
You don't need to carry every version of yourself into the next phase.
The Trader's Crib!® Weekly Takeaway

Last week contained an important lesson.
SPY did not move cleanly in one direction.
It fell.
It tested an imbalance.
It almost filled it.
It swept lower.
It reclaimed.
Then one employment report changed the market's expectations and price gapped sharply higher.
A trader emotionally attached to only one narrative probably had a frustrating week.
A trader following levels?
She had information.
That's the difference.
We enter October 5 with SPY closing at $769.64
Our nearest upside references are:
$772.65
$775.14
$778.80–$779.37
Our nearest downside references are:
$767.15
$765.65
$763.99
$762.18
$758.79
And sitting directly beneath Friday?
A fresh range gap $765.65–$767.15
That's enough information to build a plan.
You do not need twenty-seven lines on your chart.
You do not need to decide Sunday whether SPY is bullish or bearish.
You need to know:
Where is resistance?
Where is support?
What would confirm continuation?
What would invalidate my idea?
What am I willing to lose if I'm wrong?
And perhaps most importantly this week:
Do I actually have the mental space to trade well today?
Because you are not only a trader.
You are a whole woman.
Your life does not disappear at 9:30 AM.
Your responsibilities do not stop because SPY reached a level.
Your emotions do not turn off because a candle opened.
The goal is not to force your life to revolve around trading.
Build trading around the life you are creating.
Use alerts.
Know your levels.
Reduce unnecessary screen time.
Take the trade that fits your plan.
Skip the one that doesn't.
Protect your account.
Protect your nervous system.
Protect your attention.
And as this Moon disappears into the New Moon cycle, remember:
You are allowed to simplify.
You are allowed to rest.
You are allowed to miss a trade.
You are allowed to close the chart.
You are allowed to begin again.
Because longevity in trading is not built by catching everything.
It is built by staying well enough—financially, mentally and emotionally—to keep showing up.
Educate. Empower. Invest.
— The Trader's Crib!®
The Market & Moon Report is provided for educational and informational purposes only and does not constitute financial, investment, legal or tax advice. Fair value gaps, gaps, candlestick patterns, liquidity sweeps, support/resistance and other technical-analysis concepts do not guarantee future market behavior. The Vedic Astrology section reflects traditional symbolic interpretations and is presented as a mindset and reflection framework; astrology has not been scientifically established as a reliable predictor of securities prices or financial-market direction.
