

The Market & Moon Report: SPY Weekly Recap September 14–18, 2026 + Outlook for September 21–25, 2026
Market Review: September 14–18, 2026
Market & Moon Outlook: September 21–25, 2026
Presented by The Trader’s Crib!®
What. A. Week.
SPY gave traders almost everything during the week of September 14–18: a major gap down, consecutive selling sessions, a Federal Reserve-driven volatility expansion, a nearly complete fill of an important higher-timeframe fair value gap, a sharp recovery, and two consecutive sessions showing rejection of lower prices.
And beneath all of that movement, an important technical battle developed around a level that has been sitting on the chart since the powerful advance that began in late July and early August.
As we head into September 21–25, the market is sitting directly between higher-timeframe support below and unfinished bearish imbalance overhead.
In other words: the next move needs confirmation.
At the same time, our Moon cycle is moving deeper into the waxing phase. The Moon travels through sidereal Capricorn and Aquarius during the trading week before entering Pisces Friday evening, while the lunar cycle builds toward the Full Moon on Saturday, September 26.
That gives this edition of the Market & Moon Report a fitting theme:
Pressure is building — but traders still need price to tell the story.
Before we get into the charts, one reminder about how we use the Moon here at The Trader’s Crib!®: the Vedic Astrology section is intended as a timing, reflection, and mindset layer. Lunar signs and phases have not been scientifically established as predictors of financial-market direction. The technical chart remains the confirmation tool.
SPY Weekly Snapshot
SPY entered Monday following a September 11 close of $764.29. It opened the new week at $759.00, eventually traded as low as $749.60 on Wednesday, recovered to a weekly high of $763.57, and finished Friday at $761.69.
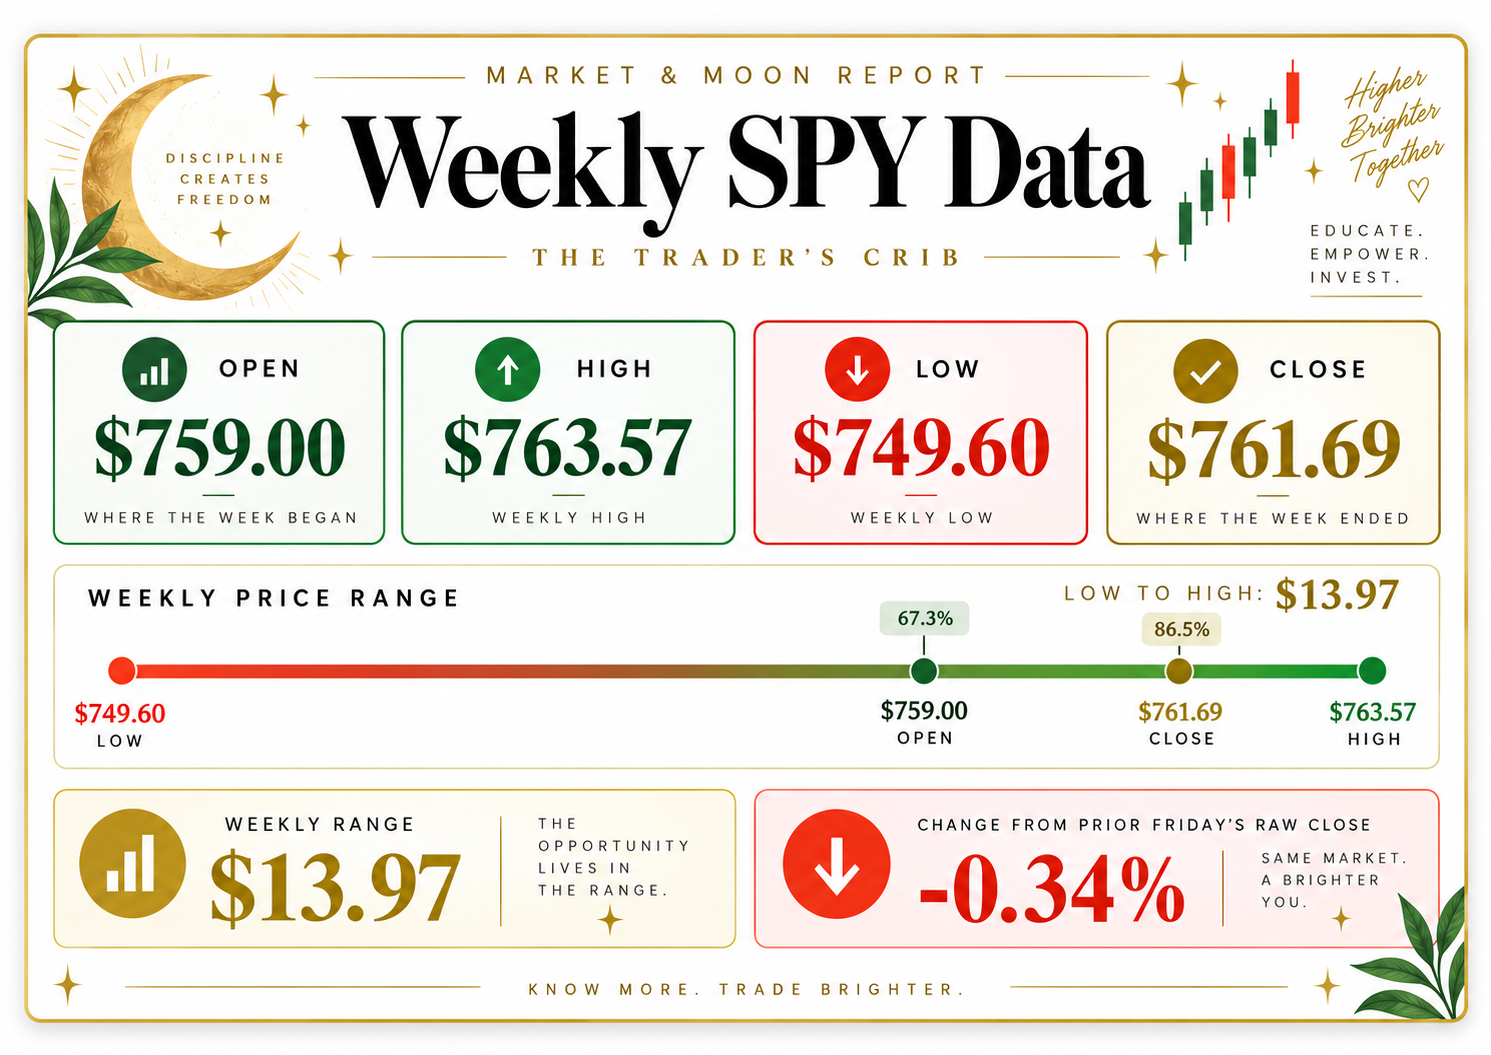
The weekly candle itself tells an interesting story.
Although SPY finished slightly below the previous Friday's raw closing price, it closed above its Monday opening price. That created a bullish-colored weekly real body of roughly $2.69.
More important was the lower shadow.
SPY traveled roughly $9.40 below its weekly open before recovering, creating a lower wick more than three times the size of the real body.
That gives the weekly candle a hammer-like appearance.
A hammer by itself is not confirmation of a reversal. What it tells us is that substantially lower prices were explored and rejected before the week ended.
Confirmation now becomes the important part.
If buyers can follow that rejection by reclaiming the overhead imbalance and resistance next week, Wednesday's plunge may ultimately be remembered as a liquidity event into higher-timeframe support.
If they cannot, the long wick may simply represent temporary buying inside an ongoing corrective move.
The Higher-Timeframe Fair Value Gap Everyone Should Be Watching
This is arguably the most important technical development of the week.
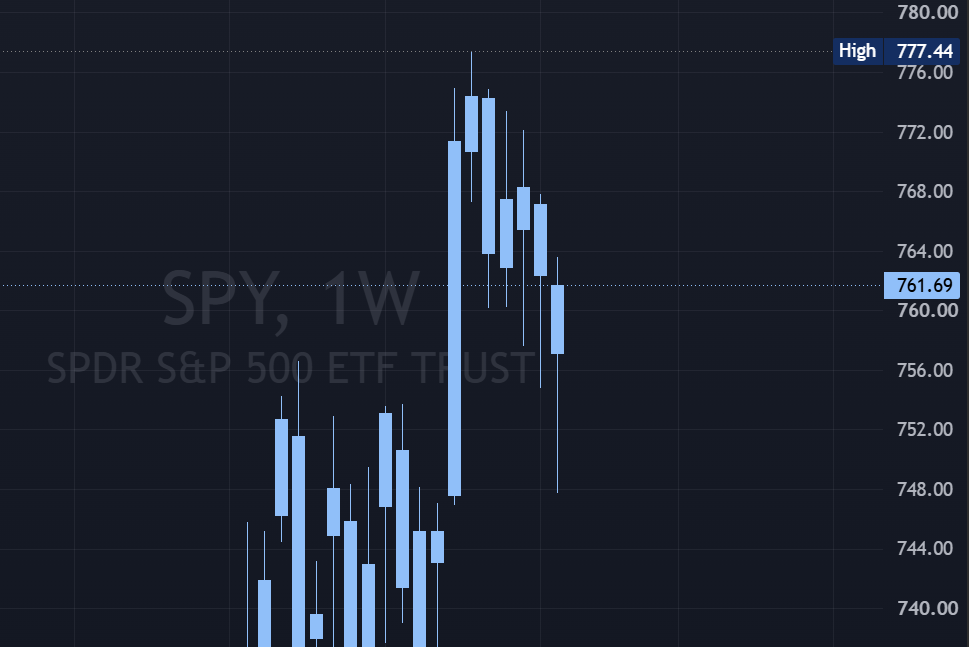
Using the traditional three-candle fair value gap framework, SPY created a significant weekly bullish fair value gap during the late-July/early-August advance.
The week ending July 31 printed a high of approximately $748.90. Two weeks later, the August 10–14 weekly candle never traded below approximately $769.20. That left a weekly imbalance between:
Weekly Bullish FVG: $748.90–$769.20
The historical daily data confirms the July 31 high of $748.90 and the August 11 low of $769.20, which was the lowest price of the August 10–14 week.
That gap has been gradually mitigated as SPY pulled back through August and September.
Then came Wednesday.
SPY fell all the way to:
$749.60
That means price came within only $0.70 of completely filling the $748.90–$769.20 weekly bullish FVG.
Approximately 96% of that higher-timeframe imbalance has now been traded through.
But technically, it remains unfinished.
That small remaining area around $748.90–$749.60 could become extremely important if bears make another attempt lower.
There is another layer of confluence here.
A daily bullish FVG created during the August 3–4 displacement also shares the $748.90 lower boundary. July 31's $748.90 high and August 4's $760.52 low created a daily imbalance between approximately:
Daily Bullish FVG: $748.90–$760.52
Wednesday's $749.60 low nearly completed that imbalance as well.
So the chart currently contains a nested daily and weekly bullish fair value gap with the same lower boundary near $748.90.
That makes $748.90 much more than a random number on the chart.
It is a higher-timeframe structural level.
Monday, September 14: The Week Begins With a Gap Down
SPY began the week under immediate pressure.
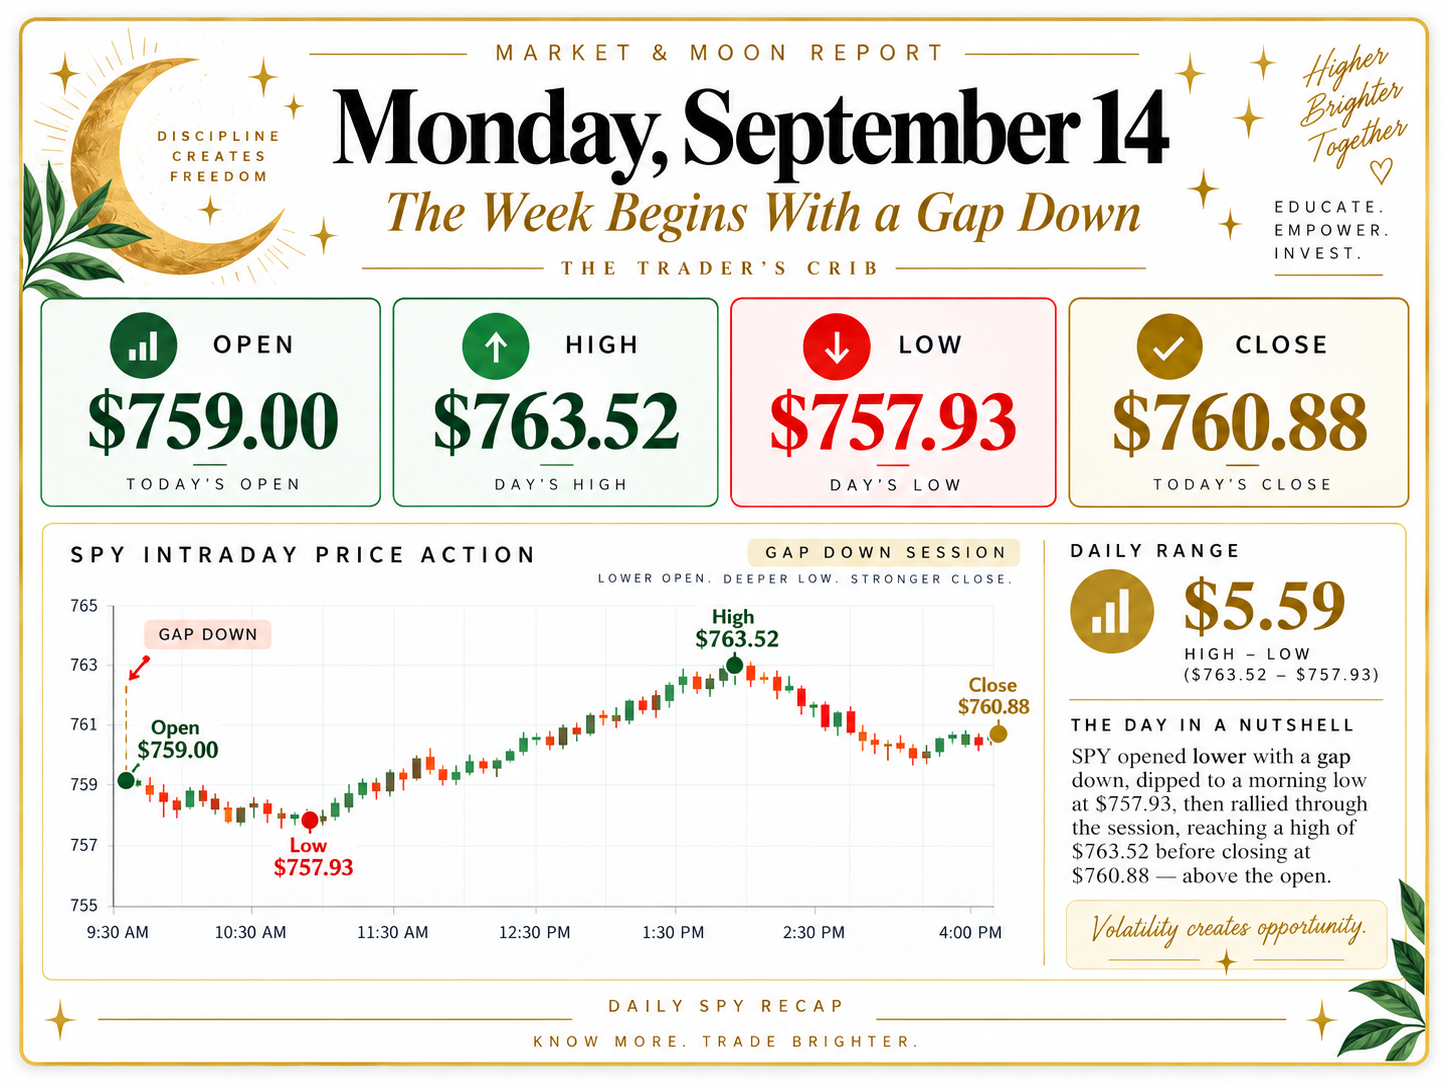
Friday, September 11 had closed at $764.29. Monday opened at $759.00 — a raw opening gap of approximately $5.29 lower.
Even more interesting, Friday's low had been $763.60 while Monday's high stopped at $763.52.
That means the entire Monday session initially remained below Friday's range, leaving a tiny but technically legitimate intersession gap between approximately:
$763.52–$763.60
Despite the weak overnight positioning, Monday's candle was not completely bearish.
SPY opened at $759.00, traded down to $757.93 and then closed at $760.88. So although it declined roughly 0.45% from Friday's close, the session itself formed a green real body.
That told us buyers were willing to respond to the initial weakness.
They simply were not strong enough to reclaim Friday's price range.
Monday's weakness also occurred as technology and semiconductor stocks came under pressure amid renewed concern surrounding AI investment and development, contributing to broader risk-off sentiment.
The important message from Monday was therefore mixed:
Buyers defended the lower prices — but sellers still controlled the gap overhead.
Tuesday, September 15: Sellers Follow Through and Create a Bearish FVG
Tuesday made Monday's warning more meaningful.
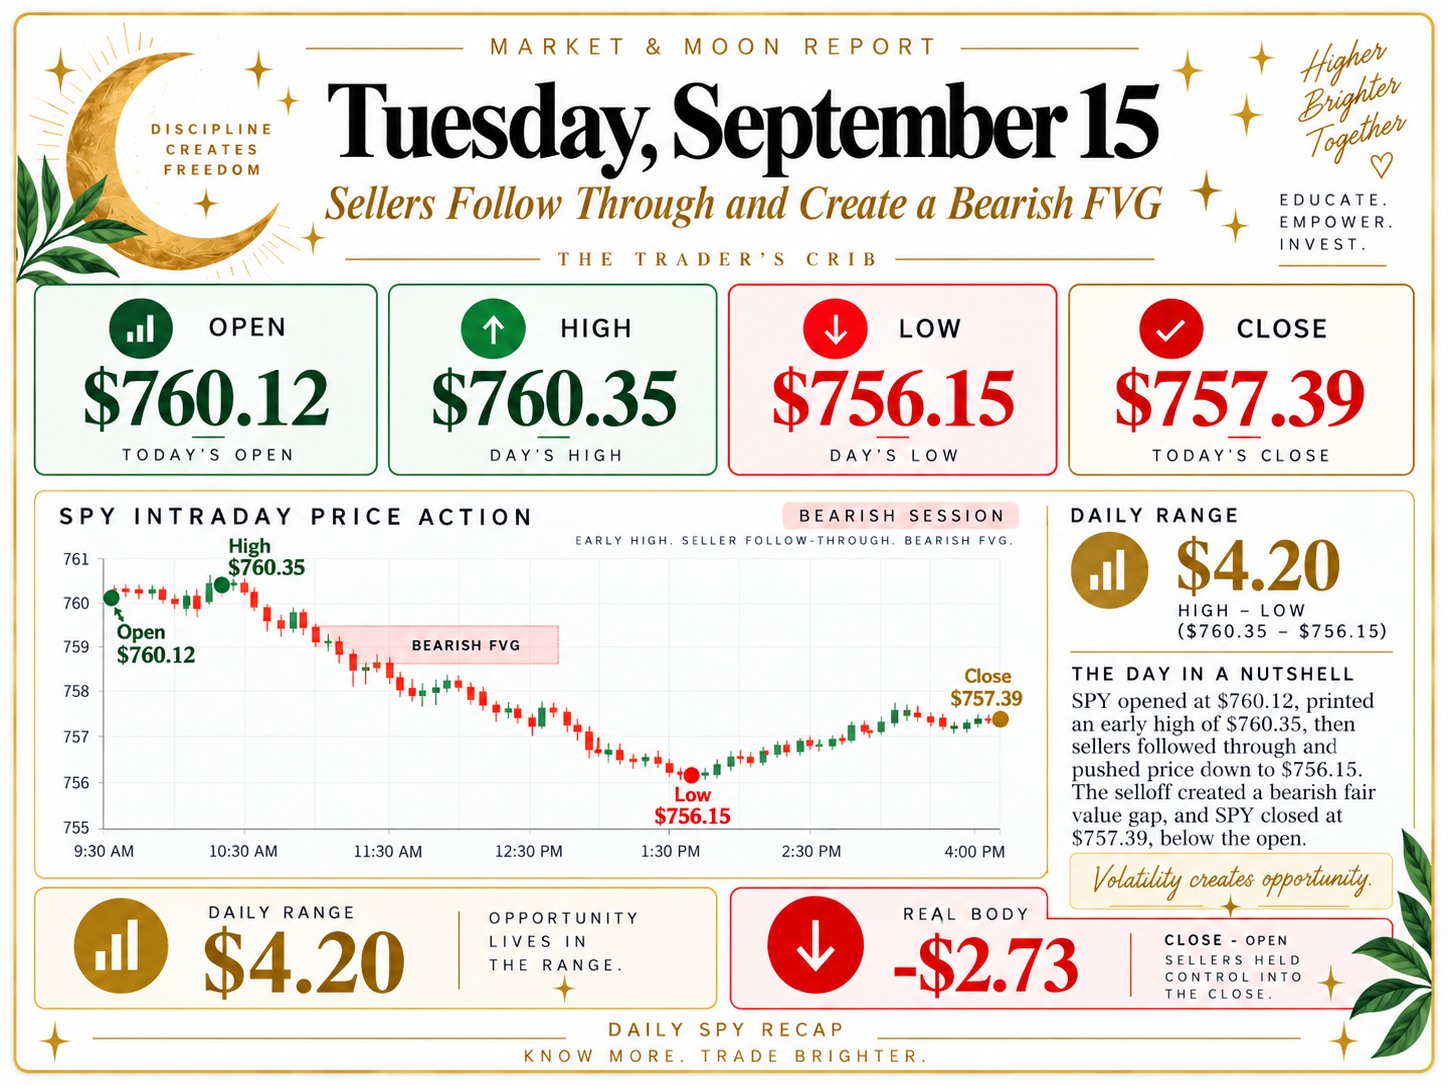
SPY attempted very little upside progress. The high came in at only $760.35 before sellers pushed price toward $756.15 and the ETF closed at $757.39.
That created a bearish-bodied continuation candle.
It also completed an important three-day formation.
Using Friday September 11 as Candle 1, Monday September 14 as Candle 2 and Tuesday September 15 as Candle 3:
Friday's low was $763.60.
Tuesday's high was only $760.35.
Because those prices did not overlap, SPY created a new:
Daily Bearish FVG: $760.35–$763.60
This becomes critical for next week's outlook because SPY eventually recovered into this imbalance — but did not completely erase it.
Macro conditions were also working against buyers Tuesday.
The benchmark 10-year Treasury yield moved through 5%, crude oil surged and markets prepared for what was expected to be the Federal Reserve's first rate increase in more than three years. The S&P 500 fell approximately 0.45% while the Nasdaq lost 0.78%.
This was a classic environment in which higher rates, higher energy costs and uncertainty around monetary policy combined to make traders less willing to aggressively buy risk.
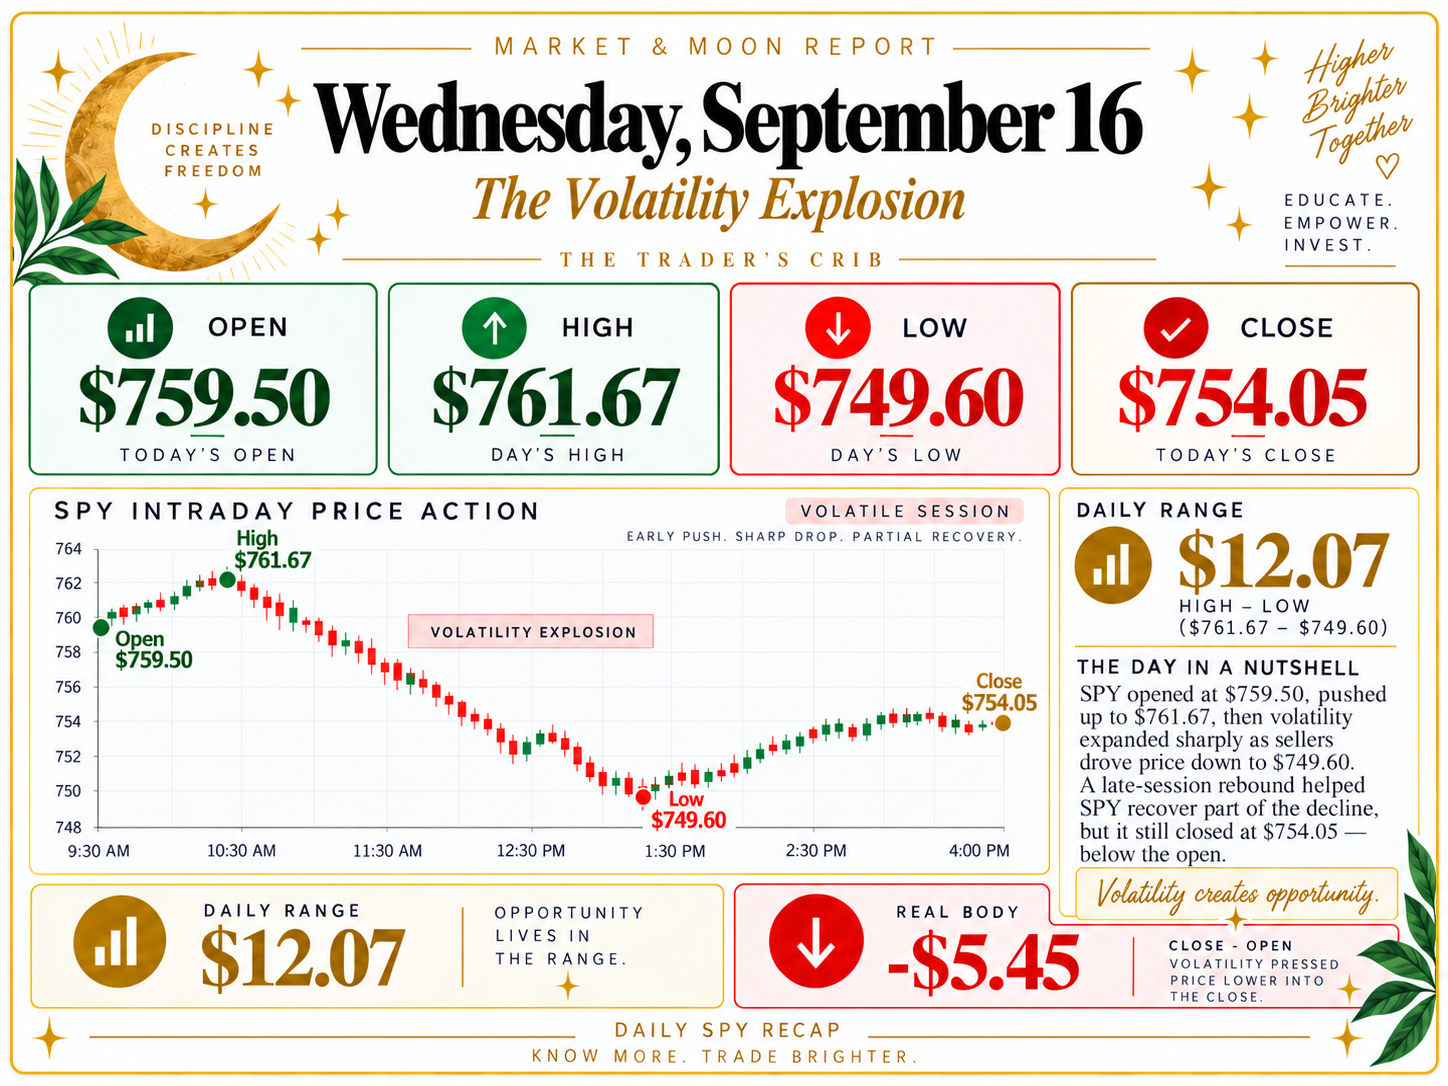
Wednesday, September 16: The Volatility Explosion
Wednesday was the defining session of the week.
The daily range expanded to more than $12, by far the largest range of the five sessions.
SPY traded as high as $761.67 but ultimately reached $749.60, before closing at $754.05.
The Federal Reserve raised its policy rate by 25 basis points — its first rate increase since 2023 — and indicated additional tightening could follow. Stocks initially moved around sharply before the major indexes ultimately finished lower. The S&P 500 declined roughly 0.44%.
Technically, Wednesday accomplished two things at once.
First, the session high of $761.67 began mitigating Tuesday's $760.35–$763.60 bearish FVG.
But the much bigger event happened below.
The plunge to $749.60 traveled through almost the entirety of the previously discussed weekly bullish FVG.
Remember:
Weekly bullish FVG: $748.90–$769.20
Wednesday stopped only seventy cents above its lower boundary.
The August daily bullish FVG at $748.90–$760.52 was also nearly completely filled.
The candle itself was bearish, but the long lower shadow matters.
SPY did not close anywhere near $749.60.
It recovered more than $4 from the low before the closing bell.
That does not prove the bottom is in.
But it tells us buyers became significantly more active as price approached the bottom of that higher-timeframe imbalance.
For students of liquidity, this is exactly why a level breaking does not automatically mean continuation.
Sometimes the question is not simply:
“Did support break?”
The better question is:
“What happened after liquidity below support was taken?”
Wednesday's answer was: price rejected the extreme low before the close.
The next two sessions would reinforce that message.
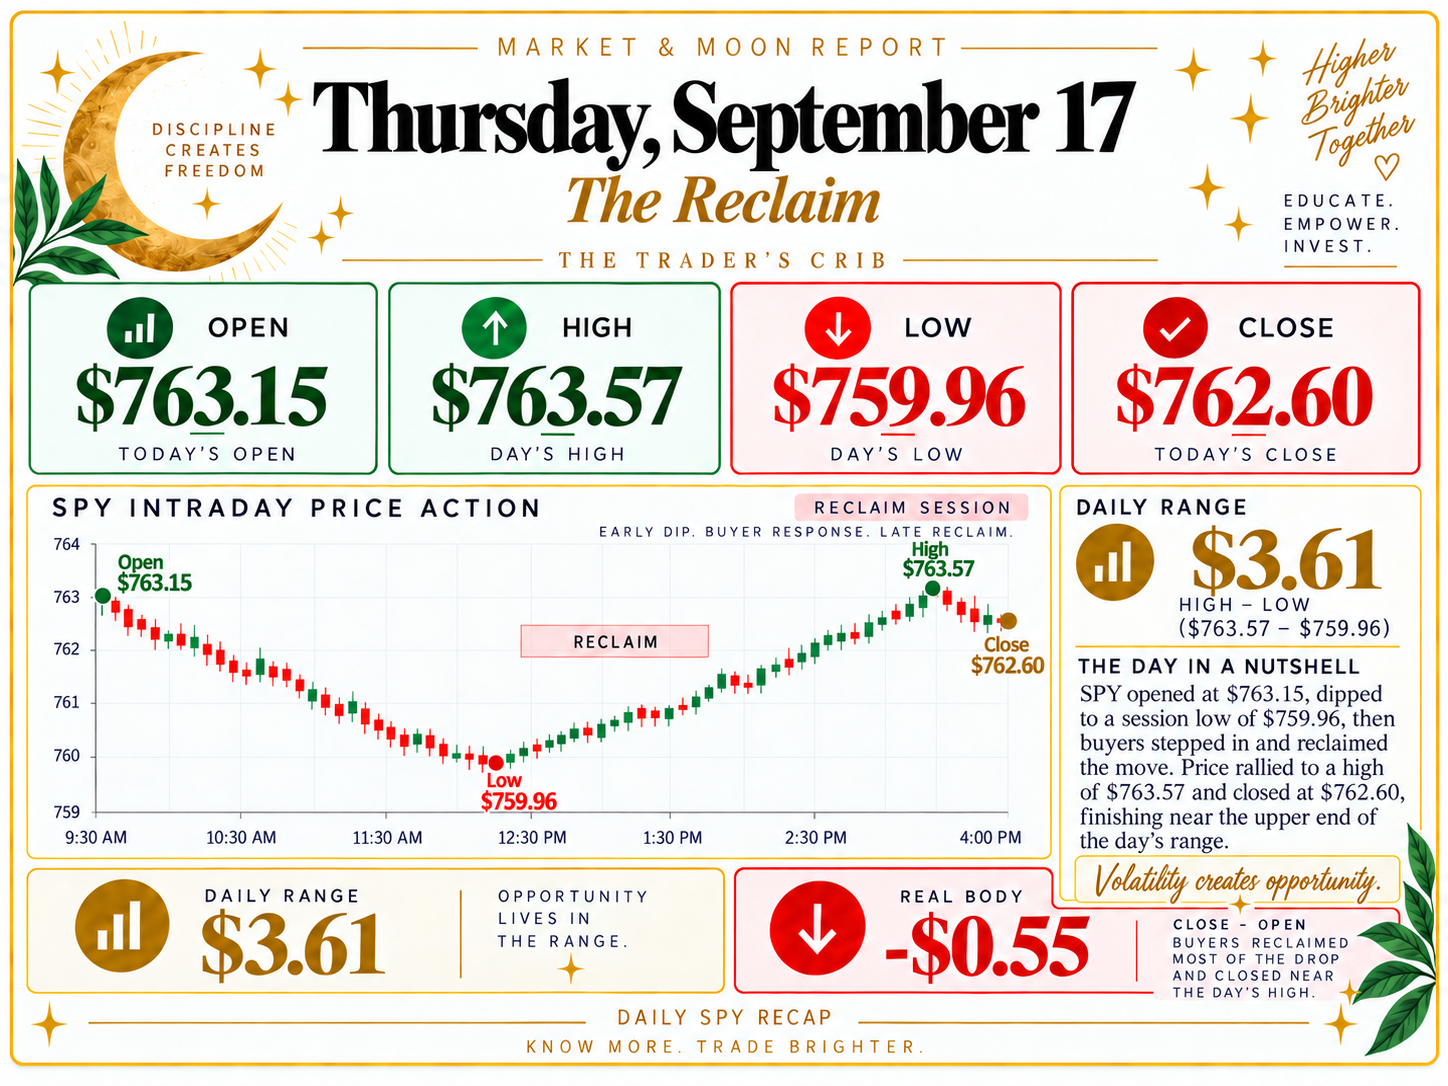
Thursday, September 17: The Reclaim
Thursday produced the strongest recovery of the week.
SPY closed approximately 1.13% higher than Wednesday.
It also opened above Wednesday's $761.67 high, creating an initial upside price gap between $761.67 and $763.15.
But that gap did not survive.
SPY later traded down to $759.96, completely filling it before recovering.
This is a useful reminder of the difference between a traditional opening gap and a fair value gap.
An opening gap can disappear almost immediately.
A three-candle FVG represents a different type of price imbalance.
Thursday's most important high was:
$763.57
Why?
Because the bearish daily FVG created earlier in the week extended to $763.60.
SPY came within just three cents of completely filling it.
The candle itself had a relatively small real body but a much longer lower wick, showing another session in which lower intraday prices attracted buyers.
Fundamentally, conditions improved as crude oil eased, Treasury yields pulled back and technology shares rallied. The S&P 500 gained roughly 1.14% and the Nasdaq gained about 1.69%.
The bulls had responded.
But they had stopped directly underneath resistance.
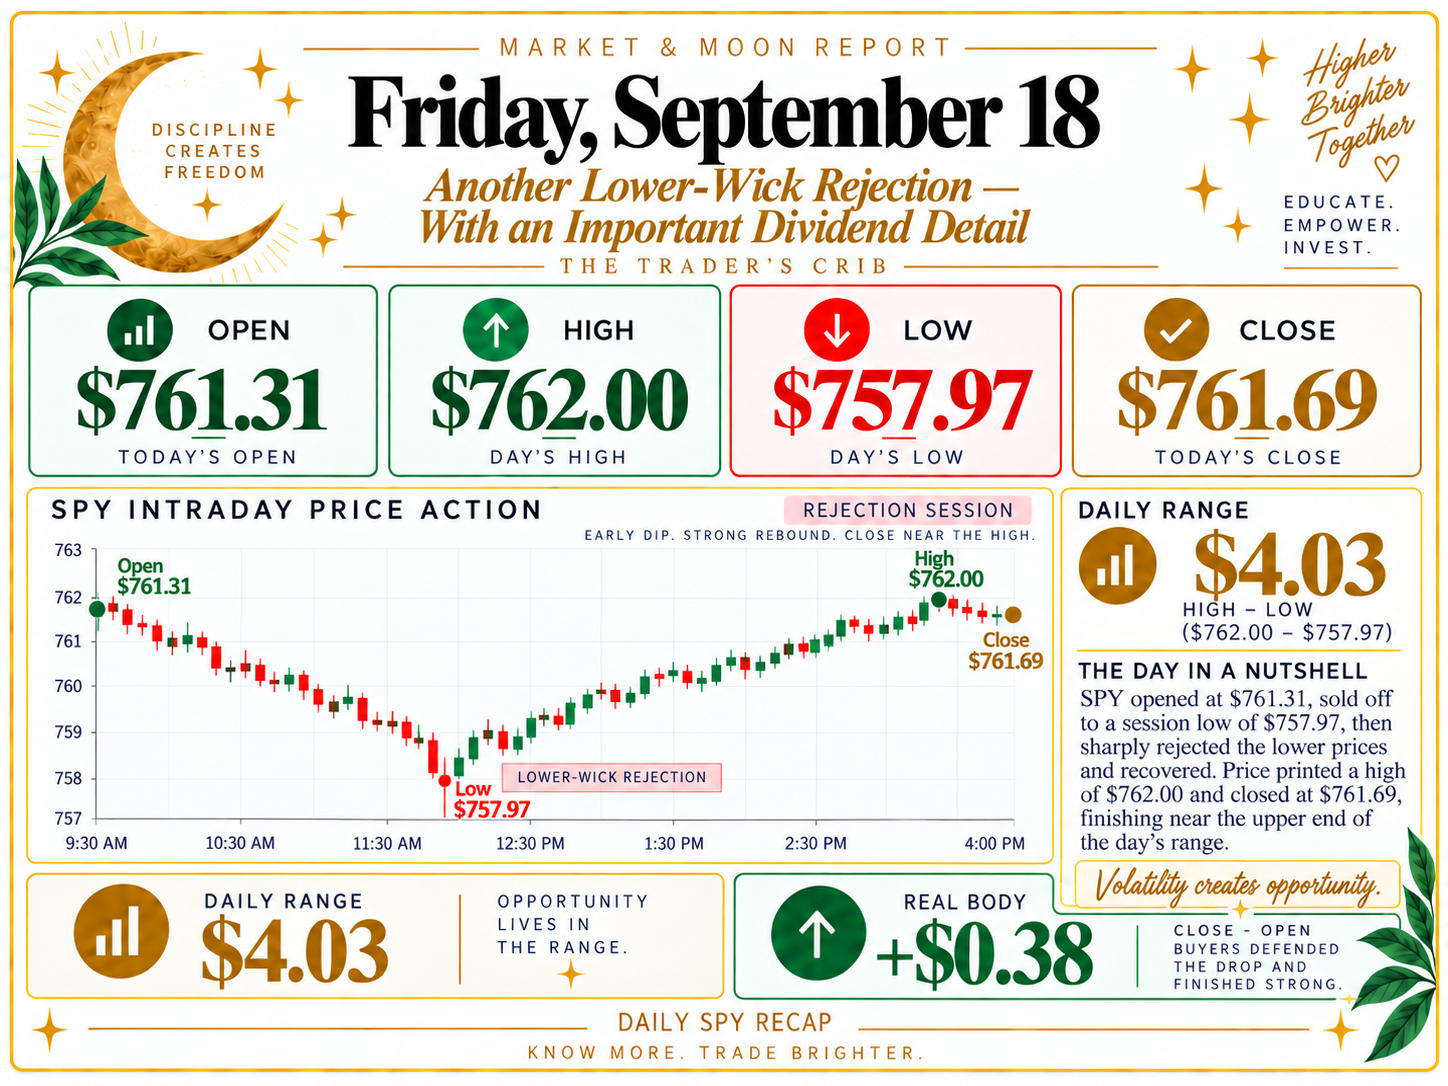
Friday, September 18: Another Lower-Wick Rejection — With an Important Dividend Detail
At first glance, Friday appears to have opened $1.29 below Thursday's $762.60 close.
But there is an important adjustment every SPY trader should know.
September 18 was SPY's ex-dividend date.
SPY went ex-dividend for approximately $1.8888 per share.
That means the apparent downside gap on the raw chart should not be interpreted as a purely bearish overnight price gap.
Adjust Thursday's $762.60 close downward by the $1.8888 distribution and the comparable adjusted price is roughly $760.71.
Against that level, Friday's $761.31 opening was actually around $0.60 higher.
This is one of those small details that can completely change how a trader reads a chart.
SPY eventually sold down to $757.97 before recovering to $761.69.
The resulting candle had an extremely small body and a long lower wick — essentially a near-doji/hammer-like rejection candle.
Raw price declined roughly 0.12% from Thursday's close, while dividend-adjusted total return was positive, which explains why some data services show approximately +0.13% for Friday.
Friday therefore gave us another session where sellers pushed price lower, but buyers brought it back toward the upper portion of the day's range.
Thursday and Friday together produced two consecutive lower-shadow rejection candles.
That is constructive behavior.
But constructive behavior below resistance is not the same thing as a confirmed breakout.
What the Entire Week Actually Told Us
When we combine the daily candles, gaps and fair value gaps, the picture becomes much clearer.
The market began the week with a substantial downside gap.
That weakness created a new daily bearish FVG from $760.35 to $763.60.
Wednesday then drove SPY almost completely through a much older weekly bullish FVG from $748.90 to $769.20 and a nested daily bullish FVG from $748.90 to $760.52.
Buyers responded.
Thursday rallied all the way back to $763.57, almost completely mitigating the bearish FVG.
Friday again rejected lower prices.
And SPY finished the week at:
$761.69
That means SPY enters the new week inside the bearish FVG.
That is our immediate battlefield.
The market has higher-timeframe demand underneath it and unfinished bearish imbalance immediately overhead.
Price is sitting between them.
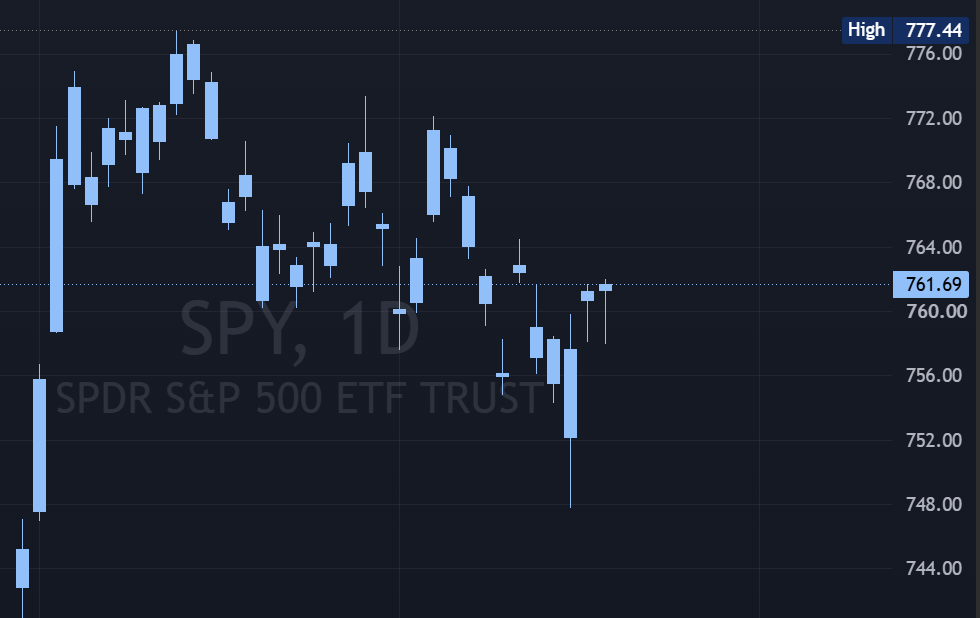
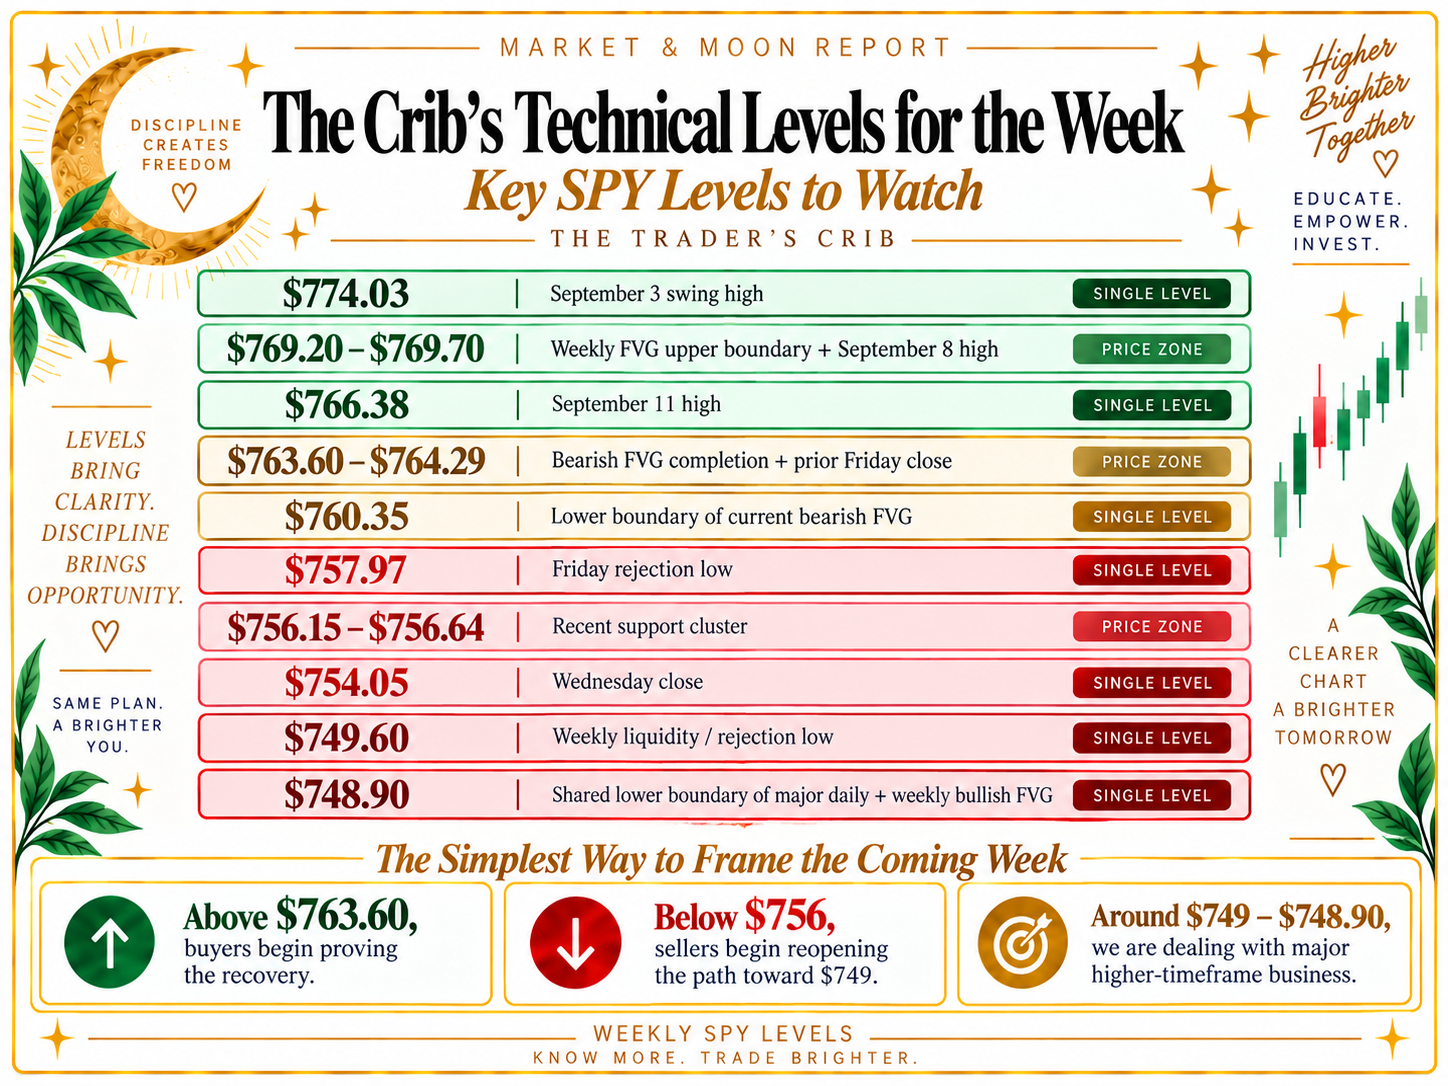
SPY Technical Map for September 21–25
Rather than attempting to predict one guaranteed direction, traders can prepare for two primary scenarios.
🟢 Bullish Scenario
The first bullish requirement is relatively simple:
Hold the recent support structure.
The $757.97 Friday low and the $756.15–$756.64 area from Tuesday and the previous week create the first important downside zone.
If buyers continue defending that region, the next job becomes reclaiming:
$763.60–$764.29
A sustained move above $763.60 would finally complete the bearish daily FVG.
Reclaiming $764.29 would also place SPY back above the September 11 close that preceded Monday's gap down.
From there, $766.38 becomes another short-term reference.
The larger upside test then sits near:
$769.20–$769.70
That zone combines the upper boundary of the major weekly bullish FVG with the September 8 high of $769.70.
A strong recovery through that area would materially improve the near-term structure.
Beyond it, the September 3 high near $774.03 becomes a logical higher reference.
In plain English:
Bulls need to turn rejection into reclamation.
A long lower wick is interesting.
Taking back resistance is confirmation.
🔴 Bearish Scenario
The bearish argument begins with the exact same area:
$763.60–$764.29
If SPY continues failing there, sellers can argue that the bearish FVG is functioning as resistance.
A move back underneath the lower edge of the FVG around $760.35 would strengthen that argument.
From there, watch the cluster between approximately:
$756.15–$757.97
A decisive loss of that area would expose Wednesday's closing region near $754.05 and, more importantly, increase the probability of another test of:
$749.60–$748.90
That is the major line in the sand.
The $749.60 low represents Wednesday's liquidity sweep/rejection point.
The $748.90 level represents the lower boundary shared by both the important weekly and daily bullish fair value gaps.
A sustained break beneath $748.90 would mean those higher-timeframe imbalances had finally been completely filled.
At that point, the bullish “FVG support” argument would lose one of its strongest technical foundations, and traders would need to reassess structure using the lower late-July price range.
So the bearish question for next week is straightforward:
Was $749.60 genuine rejection — or simply the first test before the remaining $0.70 of imbalance is eventually delivered?
Price will answer.
The Crib's Technical Levels for the Week
🌙 The Moon Report: September 21–25, 2026

Now we move from the chart to the Moon.
For the Vedic portion of the Market & Moon Report, we use the sidereal zodiac with the Lahiri/Chitra Paksha ayanamsa, rather than the tropical zodiac commonly used in Western astrology. The New York Panchang sources used here calculate their lunar positions using the Lahiri system.
The astronomical Moon is waxing gibbous throughout the trading week, building steadily toward the Full Moon on Saturday, September 26 at approximately 12:49 PM Eastern Time in New York.
Illumination climbs from approximately 78.8% Monday to 86.4% Tuesday, 92.7% Wednesday and 97.2% Thursday, with the Moon extremely close to full by Friday.
From a Vedic perspective, this is the latter portion of Shukla Paksha, the waxing half of the lunar month.
Symbolically, waxing energy is traditionally associated with building, accumulation, development and movement toward culmination.
The important word there is culmination.
Things that have been developing become harder to ignore as the Full Moon approaches.
For traders, we can translate that symbolically into a practical question:
What has the market been building toward?
Not what do we hope happens.
Not what astrology says “must” happen.
What is price progressively revealing?

Waxing Gibbous Moon in Capricorn — Makara
The Moon begins the trading week in sidereal Capricorn, or Makara Rashi. Monday's New York Panchang identifies the Moon in Capricorn, with the lunar cycle in Shukla Dashami.
Astronomically, the Moon is approximately 78.8% illuminated.
Capricorn is traditionally ruled by Saturn in Vedic astrology.
Its symbolic themes include structure, discipline, responsibility, patience, boundaries and respect for process.
Energy of Focus: Structure Before Prediction
This is an excellent tone for the beginning of a trading week.
Come in with levels already marked.
Know where your bearish FVG sits.
Know where the weekly FVG sits.
Know exactly what would invalidate your trade.
Capricorn energy does not need excitement.
It needs a plan.
Monday's trading mantra:
“I do not need to predict. I need to execute my process.”
With SPY sitting between approximately $756 support and $763–$764 resistance, that mindset may be especially useful.

Waxing Gibbous Moon in Capricorn — Shukla Ekadashi
Tuesday keeps the Moon in sidereal Capricorn. New York Panchang calculations show Shukla Ekadashi, transitioning later into Dwadashi; one New York calculation places the Ekadashi transition near 12:13 PM Eastern.
Moon illumination rises to approximately 86.4%.
The Capricorn/Saturn theme therefore continues.
But Ekadashi traditionally carries symbolism surrounding restraint, simplification, purification and stepping away from excess.
For traders, we do not need to turn that into a mystical market forecast.
Instead, it gives us an excellent psychological theme:
Energy of Focus: Less Noise, Better Decisions
Do you need five trades?
Or was one A+ setup enough?
Do you need another indicator?
Or is price already telling you everything you need?
Do you need to chase SPY because it moved without you?
Or can you wait for your level?
Tuesday's focus is disciplined restraint.
In trading, protecting capital is an action too.
Sometimes the best position really is no position.

Capricorn → Aquarius During the Trading Session
Wednesday is the most interesting Vedic transition day of the week.
The Moon begins the day in sidereal Capricorn and crosses into Aquarius/Kumbha at approximately 12:26–12:27 PM Eastern Time based on Lahiri sidereal calculations.
The Moon is roughly 92.7% illuminated.
The lunar day begins in Shukla Dwadashi, with the New York Panchang placing the transition into Trayodashi around 1:21 PM Eastern.
So Wednesday contains a meaningful symbolic transition right around the middle of the market session.
The morning carries Capricorn's disciplined, controlled, structural tone.
Then Aquarius enters.
Aquarius is also traditionally connected to Saturn in Vedic astrology, although Rahu is strongly associated with Aquarius in several Vedic traditions.
Where Capricorn asks:
“What is the structure?”
Aquarius asks:
“What is the larger system doing?”
Energy of Focus: Adapt Without Abandoning Your Rules
Wednesday may be a useful day to pay attention to changing market character.
Is volume expanding?
Are semiconductors confirming SPY?
Are Treasury yields moving opposite equities?
Is breadth supporting the headline index?
Is price accepting above resistance or repeatedly rejecting it?
The symbolic shift is from individual structure toward collective behavior and systems thinking.
For a trader:
Keep the rules.
But stay flexible about the outcome.

Waxing Gibbous Moon in Aquarius — Kumbha
Thursday places the Moon firmly in sidereal Aquarius throughout the trading session. New York Panchang calculations identify the Moon in Aquarius, with Shukla Trayodashi transitioning toward Chaturdashi during the afternoon.
The Moon is approximately 97.2% illuminated — very close to full.
Aquarius is associated with networks, systems, groups, collective behavior, innovation, observation and detachment.
That word detachment may be the most useful one for traders.
Energy of Focus: Observe the Crowd Without Becoming the Crowd
When markets begin moving quickly, traders often stop observing price and start participating emotionally.
Everybody is bullish, so we become bullish.
Everybody is bearish, so we become bearish.
SPY breaks a level, so we assume continuation.
SPY rallies, so we assume the low must be in.
Aquarius energy symbolically encourages us to zoom out.
What is the market collectively doing?
More importantly:
Is price confirming the crowd's story?
With the Moon approaching full illumination, Thursday's practice is to remain objective even if volatility and emotions start rising.

Aquarius During Market Hours → Purnima Tithi Begins
Friday may carry the strongest sense of culmination.
The Moon remains in sidereal Aquarius throughout regular U.S. market hours and does not enter Pisces until approximately 8:03 PM Eastern, after the closing bell.
The day begins in Shukla Chaturdashi.
Then at approximately:
1:37 PM Eastern
the Vedic Purnima tithi begins.
There is an important distinction here.
Purnima tithi begins Friday afternoon, but the exact astronomical Full Moon does not occur until Saturday, September 26 at approximately 12:49 PM Eastern.
So Friday's market closes with the Moon essentially at the culmination of the waxing cycle.
Energy of Focus: Completion, Review and Emotional Discipline
Full-Moon periods are traditionally associated in astrology with culmination, visibility, heightened awareness and bringing something to completion.
From a trading perspective, there is no need to assume that means bullish or bearish.
Instead, use it as a personal checkpoint.
What did the chart confirm this week?
What trade worked?
What trade should never have been taken?
Where did emotion override your plan?
Did you chase?
Did you revenge trade?
Did you honor your stop?
Did you wait for confirmation?
Friday's energy is less about predicting SPY and more about completing the trading week consciously.
Close the charts.
Review the journal.
Take the lesson.
Then reset.
The Moon's Trading-Week Rhythm
Date | Vedic Moon Sign During Market Hours | Lunar Phase | Energy of Focus |
|---|---|---|---|
Mon. Sept. 21 | Capricorn | Waxing Gibbous ~78.8% | Structure, discipline, preparation |
Tue. Sept. 22 | Capricorn | Waxing Gibbous ~86.4% | Restraint, patience, simplify |
Wed. Sept. 23 | Capricorn → Aquarius around 12:26 PM ET | Waxing Gibbous ~92.7% | Adaptability, systems thinking |
Thu. Sept. 24 | Aquarius | Waxing Gibbous ~97.2% | Detachment, observe collective behavior |
Fri. Sept. 25 | Aquarius | Near Full / Purnima tithi begins ~1:37 PM ET | Culmination, review, emotional discipline |
After Friday's close, the Moon enters sidereal Pisces, shifting the symbolic emphasis toward reflection, intuition and release as the exact Full Moon approaches Saturday.
Where the Market and Moon Meet This Week
There is an interesting parallel between the technical chart and the lunar cycle — not because one necessarily causes the other, but because both are sitting near a point of culmination.
SPY has nearly completed a major higher-timeframe bullish fair value gap.
The bearish fair value gap above has nearly been completed too.
And the Moon is nearly full.
There is unfinished business on both sides of SPY.
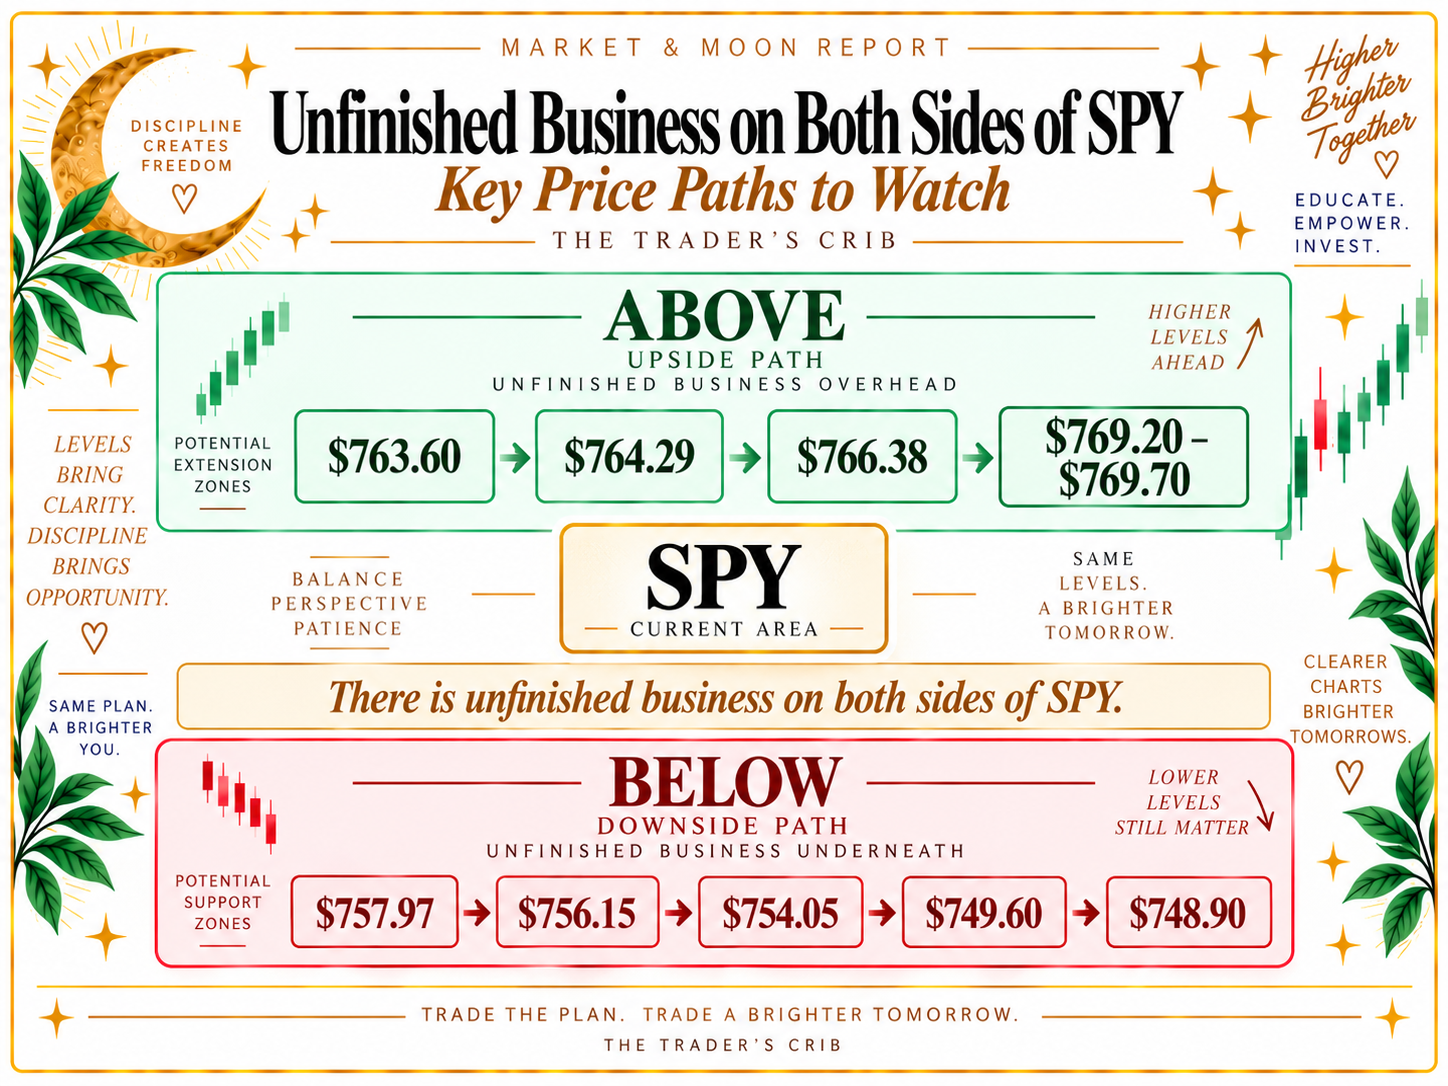
That creates a week where patience may matter more than prediction.
We do not need to decide Sunday night that SPY is bullish.
We do not need to decide that it is bearish.
We can allow the market to show us which side of this range receives acceptance.
The Trader’s Crib!® Weekly Takeaway

Last week was not simply a selloff followed by a bounce.
It was a test of major market structure.
SPY traveled almost entirely through a weekly imbalance that has existed since the powerful summer advance.
The market found buyers near its lower boundary.
Those buyers produced a significant Wednesday rejection, a strong Thursday recovery and another lower-wick rejection Friday.
But the recovery stopped almost perfectly at the bearish imbalance created earlier in the week.
That leaves us with one of the cleanest questions a trader can have:
Can SPY reclaim $763.60–$764.29?
If yes, buyers begin opening the door toward $766 and the $769 area.
If no — and SPY begins losing $760, $758 and especially the $756 area — Wednesday's low can come back into play.
And if $749.60 is revisited?
Watch $748.90 closely.
That is where both a major weekly and daily fair value gap reach their lower boundary.
The chart does not need us to guess what happens next.
It needs us to be prepared for what happens next.
As the Moon grows toward full illumination this week, let that be our trading reminder too:
Bring more awareness to the trade — not more emotion.
Follow price.
Respect the levels.
Protect the account.
And above all:
Trade what you see, not what you think should happen.
— The Trader’s Crib!®
The Market & Moon Report is provided for educational and informational purposes only and does not constitute financial, investment, legal or tax advice. Fair value gaps, candlestick patterns and technical levels are analytical frameworks and do not guarantee future price behavior. The astrology portion reflects traditional Vedic interpretations and is provided as a mindset and reflection framework; astrology has not been scientifically established as a reliable predictor of financial-market direction. Always conduct your own analysis and manage risk appropriately.
