

SPY Reclaims Higher Ground, Fills the Gaps & Heads Into a Data-Heavy Week
SPY Weekly Recap: September 21–25, 2026 | Outlook: September 28–October 2, 2026
Presented by The Trader’s Crib!®
Last week gave us a beautiful reminder of why traders need a map, not a prediction.
SPY began the week with an aggressive gap higher, ran directly into recent highs, stalled, reversed hard midweek, filled most of the imbalance it had just created—and then recovered again into Friday.
So was the week bullish?
Overall, yes: SPY finished meaningfully higher than the previous Friday.
Was it clean?
Absolutely not.
And that is exactly what makes this week's chart worth studying.
Between September 21 and September 25, SPY created both a bullish daily fair value gap and a bearish daily fair value gap. By the end of the week, both had been heavily mitigated, but neither was completely erased.
That leaves us entering September 28–October 2 with unfinished business on both sides of price.
Meanwhile, our lunar cycle has shifted as well. Saturday's Full Moon marks the beginning of a waning phase, and during the upcoming trading week the sidereal Moon moves through Aries, Taurus and Gemini.
For the women of The Trader's Crib!®—whether you're trading while running a business, working a full-time job, caring for family, studying, managing a household, or simply trying to preserve some mental space for yourself—this week's Moon theme is particularly useful:
Less forcing. More filtering.
Let's get into it.
First: A Note About the SPY Data
This edition uses SPY's regular, unadjusted session OHLC prices for September 21–25.
Because SPY's September quarterly ex-dividend event occurred on September 18, all five sessions reviewed here are already on the same post-dividend price basis. That means we can compare this week's candles, gaps and FVGs directly without mixing adjusted and unadjusted chart values.
Historical data from Yahoo Finance and Stock Analysis agree on the week's daily OHLC values. Yahoo Finance
SPY Weekly Snapshot: September 21–25, 2026
That gives us a weekly candle of:

SPY gained approximately 1.27% from the previous Friday's $761.69 close. Yahoo Finance
The weekly candle itself was bullish, with a real body of roughly $5.10.
But both sides produced meaningful wicks.
Price traded as high as $775.14 before settling $3.79 below that high, while buyers defended a dip to $763.25 and brought price $8.10 above the weekly low by Friday's close.
That tells us something important:
Buyers won the week—but sellers absolutely showed up near $775.
This is not a chart where either side gets to relax yet.
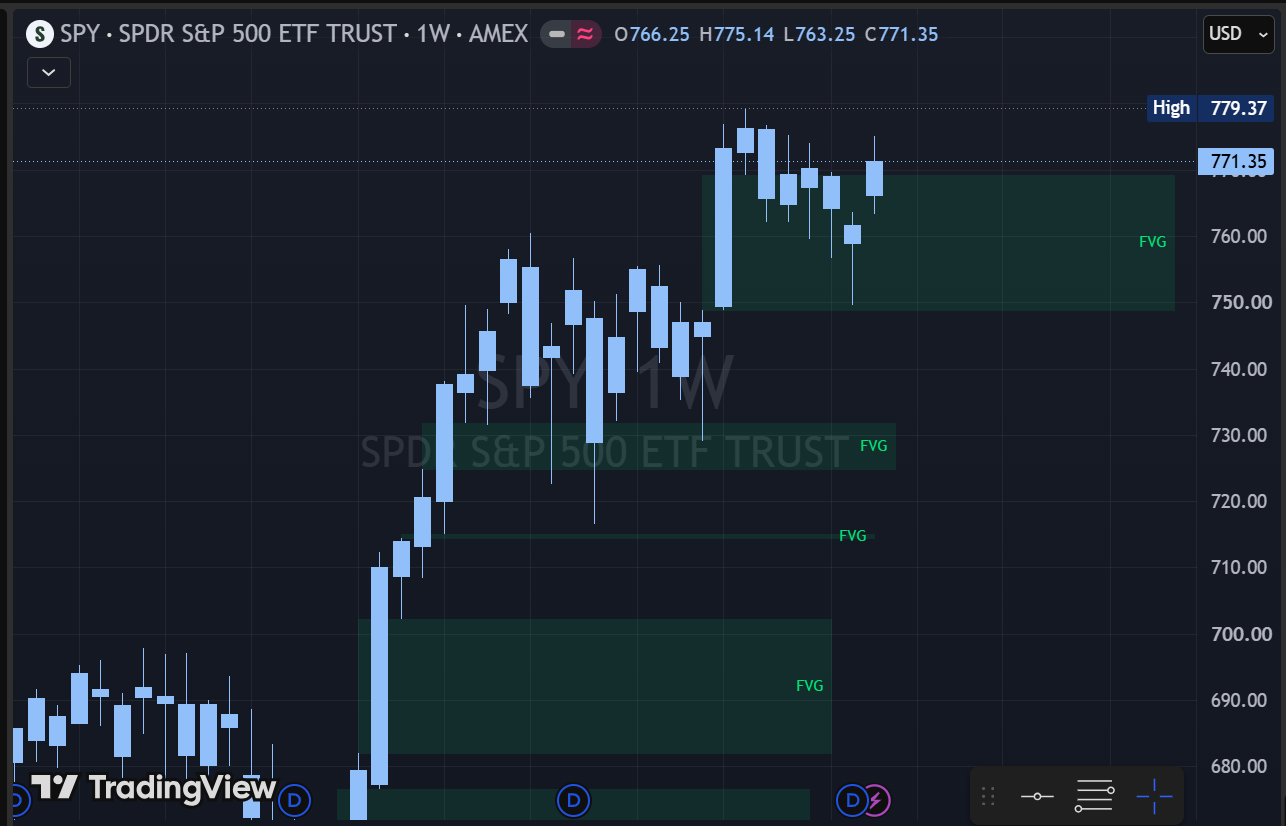
The Bigger Weekly Fair Value Gap Story
If you've been following The Market & Moon Report, you already know that we've been watching the large bullish weekly imbalance created during the late-July/early-August expansion.
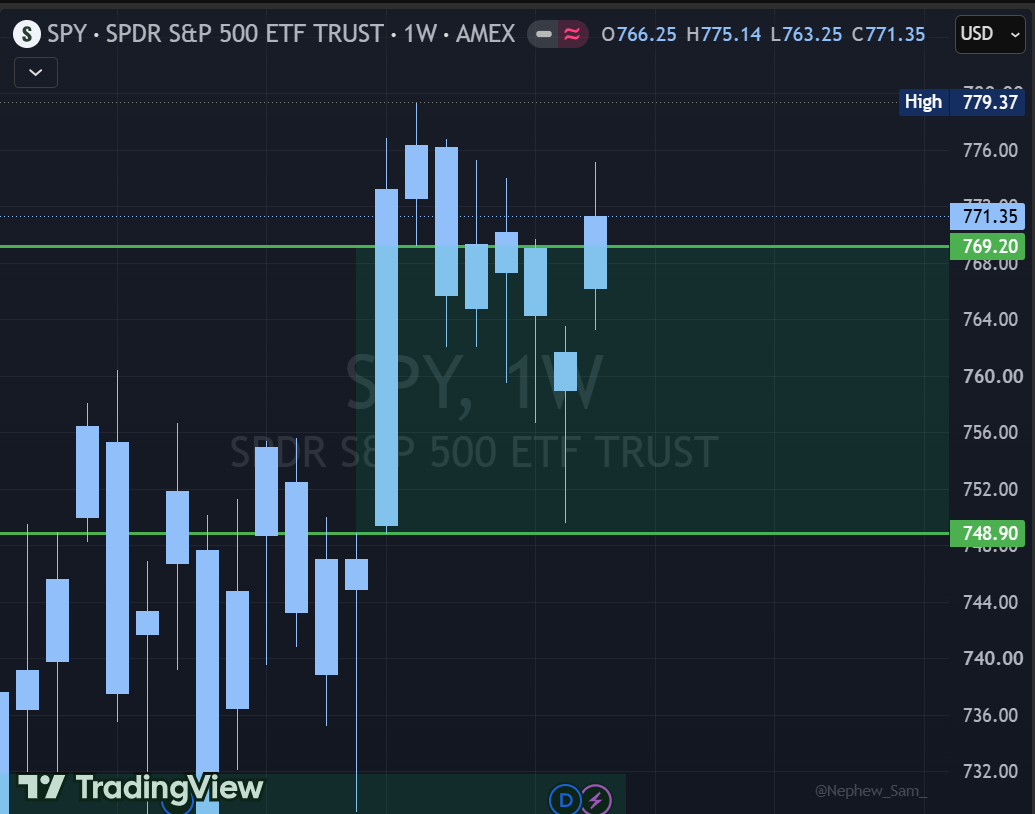
Using the raw historical chart, that original weekly bullish FVG extended approximately from: $748.90 to $769.20
Those boundaries came from the July 31 high and the lowest price of the August 10–14 weekly candle, which occurred August 11 at $769.20. Yahoo Finance
During the previous week's selloff, SPY fell to $749.60, leaving only a tiny portion near the bottom of that imbalance untouched.
This week did something different.
SPY never went anywhere near the bottom of that zone.
Instead, it finished Friday at $771.35
—back above the original FVG's $769.20 upper boundary.
That doesn't magically turn the entire prior imbalance into guaranteed support.
But structurally, it tells us that after deeply mitigating that weekly FVG the previous week, price was able to reclaim the top of the zone.
Also important:
The September 7–25 three-week sequence did not create a new weekly fair value gap.
So our more immediate story is now on the daily chart.
And that story is fascinating.
The Two Daily FVGs That Defined the Week
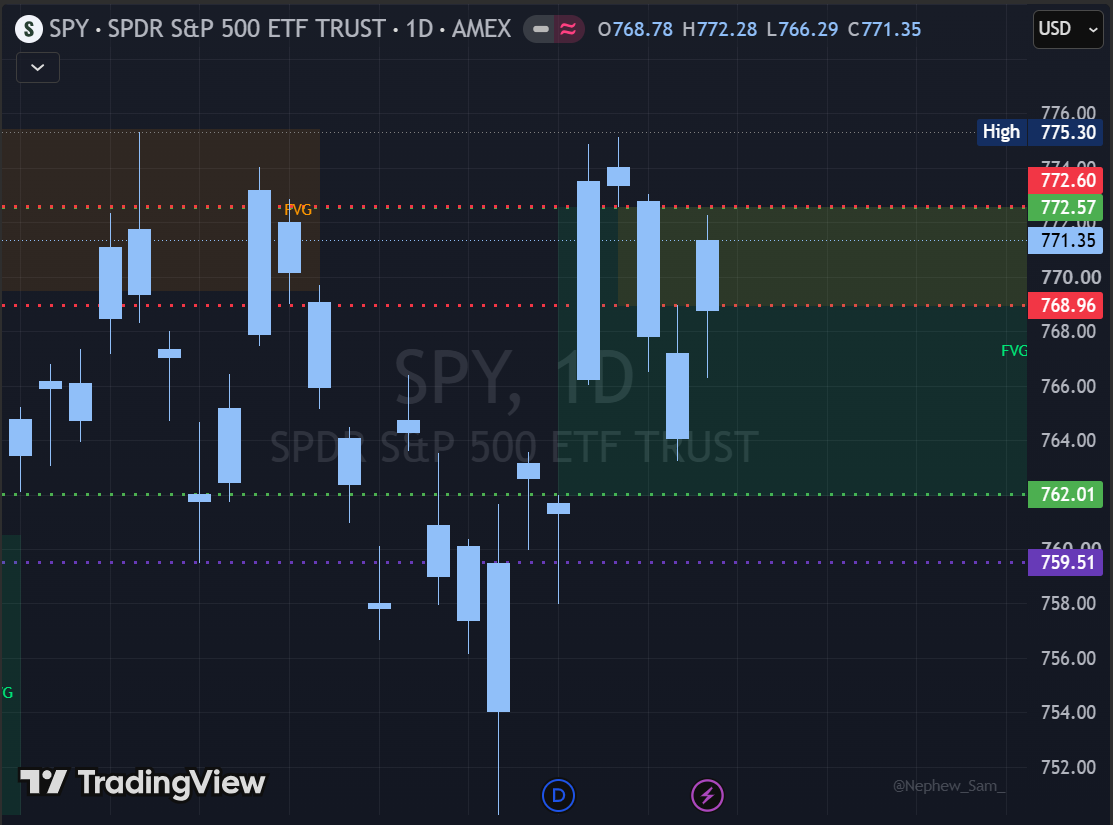
This week essentially built an imbalance in one direction—and then another imbalance in the opposite direction.
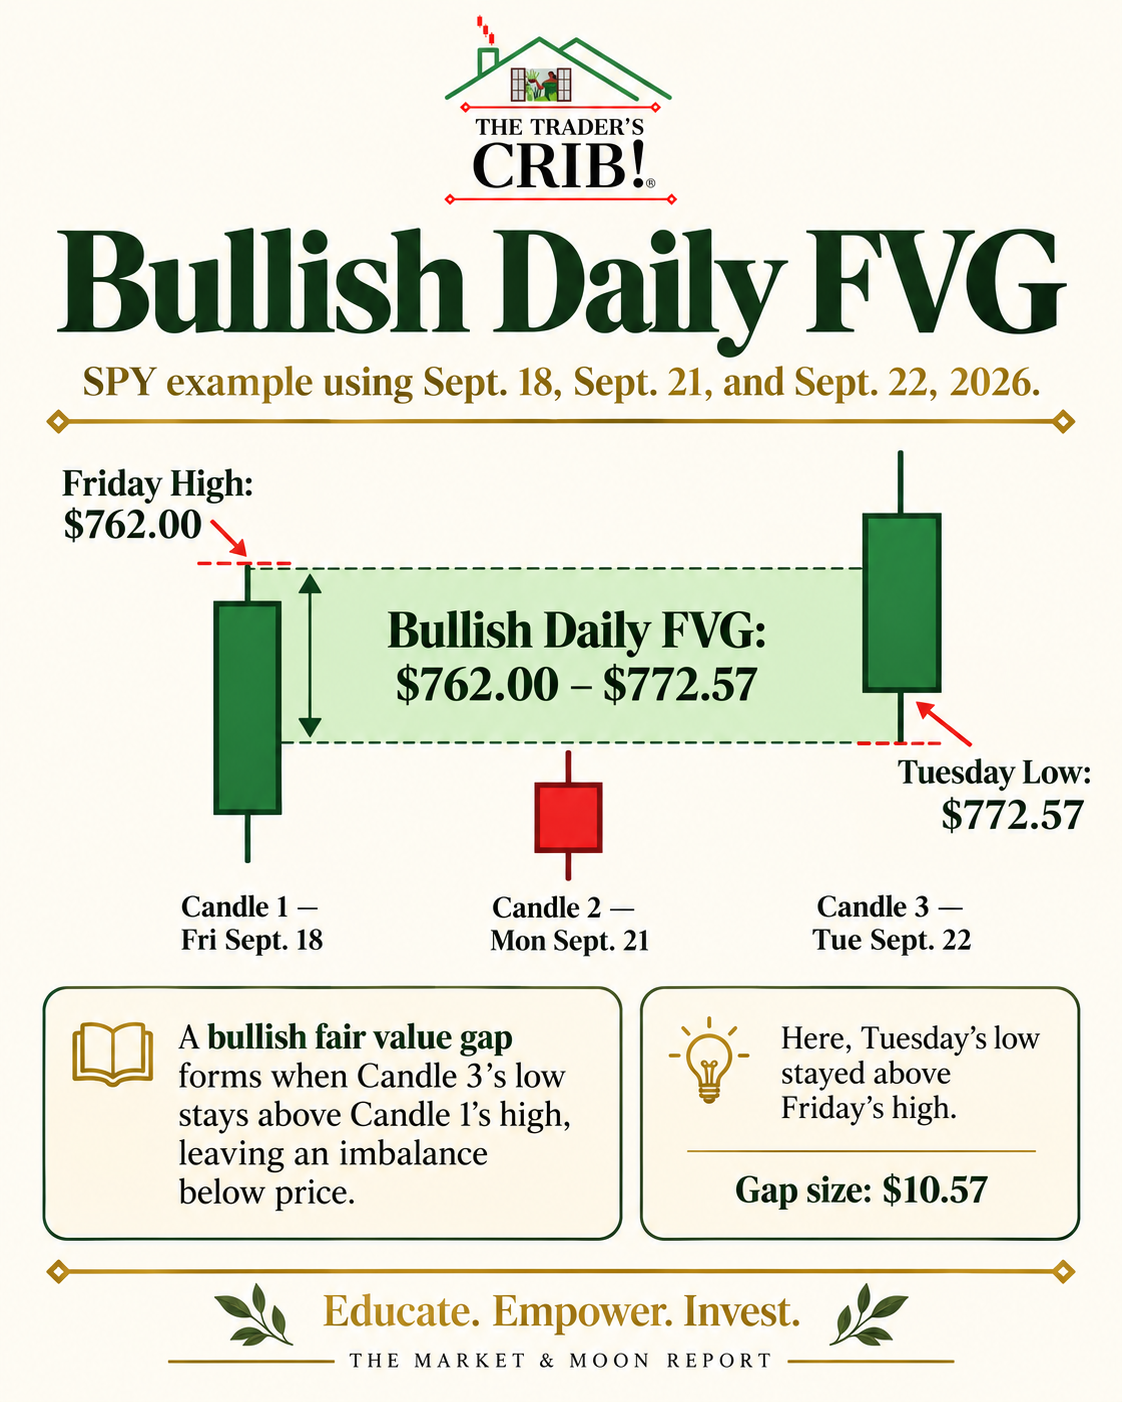
Then price reversed.
Wednesday traded down to $766.50.
Thursday went even deeper, reaching $763.25
That means approximately 88% of the bullish daily FVG was mitigated.
But it was not completely filled.
The remaining unfilled portion sits approximately at: $762.00–$763.25
That area is going to matter next week.
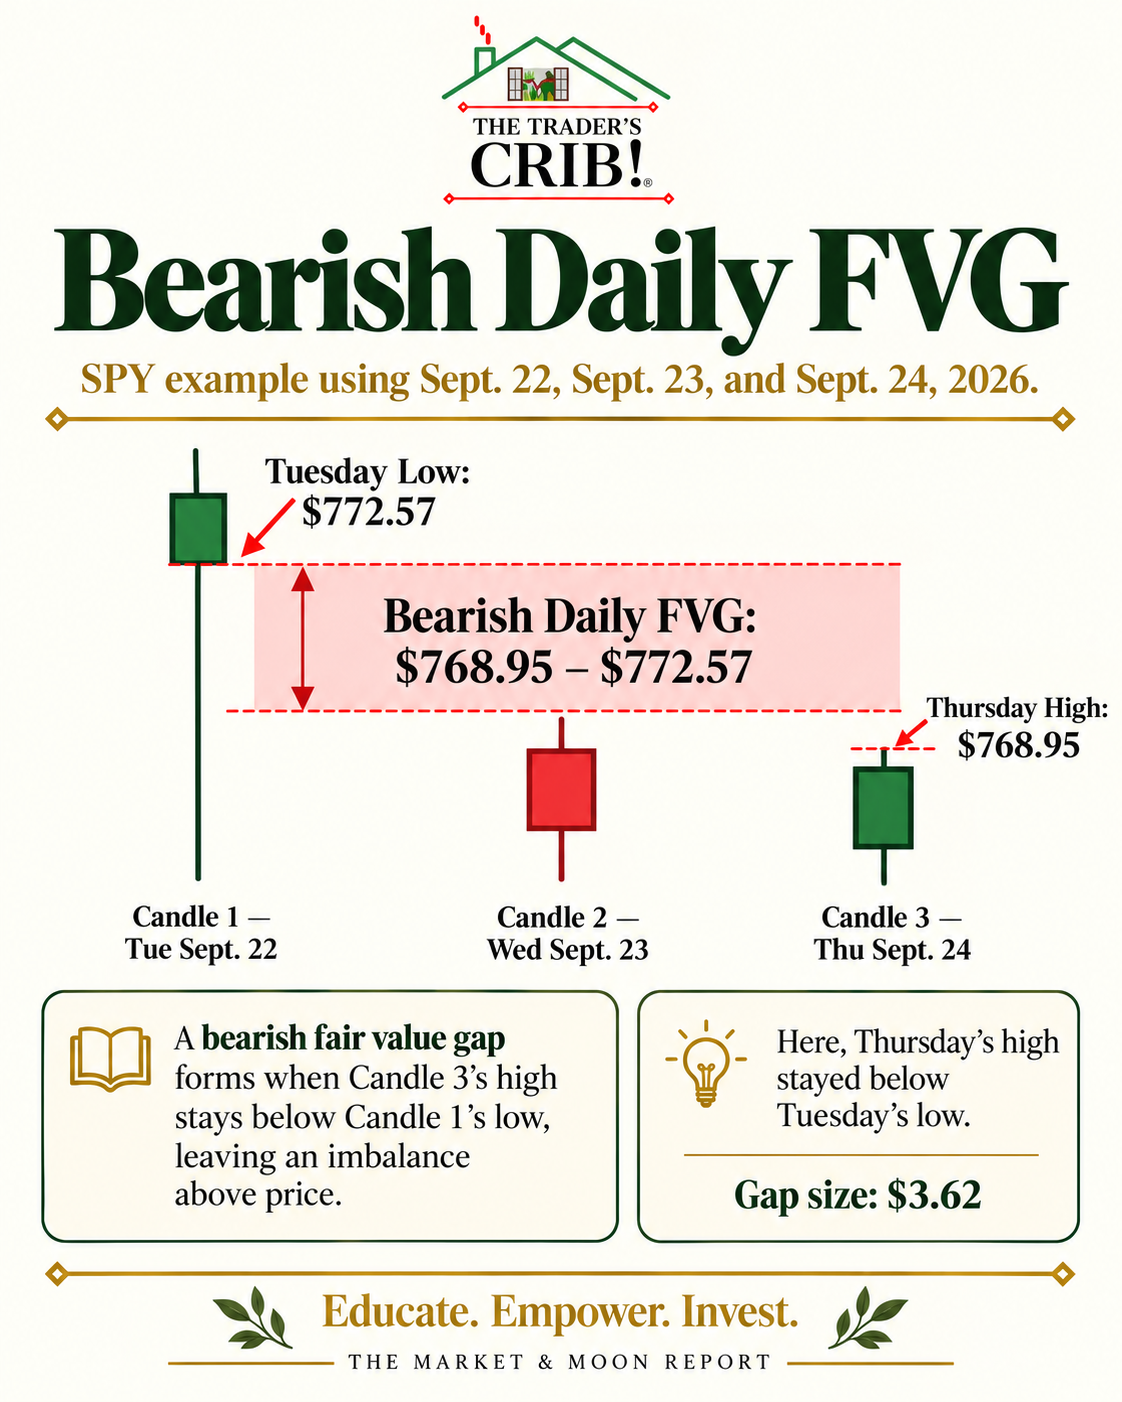
Then Friday rallied.
Friday reached $772.28
So SPY mitigated roughly 92% of that bearish imbalance.
But again:
It did not completely fill it.
The tiny remaining portion sits around $772.28–$772.57
Now look at the chart from a distance.
We enter next week with:
Unfinished bullish FVG below: $762.00–$763.25
and
Unfinished bearish FVG above: $772.28–$772.57
That is a beautifully defined technical battlefield.
Monday, September 21
Gap. Expansion. Reclamation.
Open: $766.25 - High: $774.89 - Low: $766.03 - Close: $773.50
Monday didn't ease into the trading week.
It arrived.
SPY had closed Friday at $761.69.
Monday opened at $766.25
—a $4.56 gap higher from Friday's close.
More importantly, Friday's high had been only $762.00 while Monday's low was $766.03.
So price left a genuine gap between the two daily ranges: $762.00–$766.03
And Monday never looked back.
SPY opened near the day's low, formed only a tiny lower wick, and powered toward $774.89 before closing at $773.50.
That is a strong bullish expansion candle.
Not perfectly wickless, so I wouldn't call it a textbook marubozu—but the message was very similar:
Buyers controlled almost the entire session.
Macro conditions supported that move. U.S. equities rallied sharply Monday as technology and AI-related shares advanced, while easing oil prices and Treasury yields helped improve risk appetite. The S&P 500 gained about 1.5%. Reuters
Technically, Monday did several things at once:
Cleared the $767 area we had been watching
Reclaimed the upper boundary of the older weekly FVG
Gapped above Friday
Pressed toward the August/September highs
Created the displacement leg that would later form the new bullish daily FVG
It was an impressive start.
But markets rarely move in a straight line.
Tuesday reminded us of that.
Tuesday, September 22
Momentum Pauses at $775
Open: $774.03 - High: $775.14 - Low: $772.57 - Close: $773.38
Tuesday opened slightly higher—but Monday's explosive momentum disappeared almost immediately.
The total session range contracted to only about $2.57
And the real candle body was just -$0.65
With wicks above and below the body, Tuesday formed a small bearish spinning-top style candle.
Translation?
Indecision.
After Monday's enormous expansion, neither side could convincingly take control.
But Tuesday did establish something extremely important:
$775.14 became the weekly high.
The Nasdaq pushed to a record intraday high Tuesday as AI enthusiasm remained strong, but the broader S&P 500 finished essentially flat. Oil also moved lower during the session. Reuters
Technically, Tuesday completed the three-candle sequence that confirmed the:
$762.00–$772.57 bullish daily FVG.
But the small candle at the top was also our first warning that buyers weren't getting effortless continuation.
When a market expands aggressively and then prints a tight, indecisive candle at resistance, the next session deserves your full attention.
Wednesday answered the question.
Wednesday, September 23
The Reversal Arrives
Open: $772.79 - High: $773.05 - Low: $766.50 - Close: $767.81
Wednesday was the first decisive bearish session of the week.
SPY opened slightly below Tuesday's close.
Then buyers barely managed to lift price to $773.05.
That was it.
Sellers took over and drove SPY to $766.50 before the close.
The candle's bearish body measured almost $5.00
That is very different from Tuesday's small spinning top.
Wednesday essentially took Tuesday's indecision and resolved it to the downside.
Oil prices and Treasury yields rose Wednesday, weighing on stocks. Reuters also reported that stronger U.S. business-activity data reinforced expectations that the Federal Reserve could continue tightening policy. Fidelity
From a chart perspective, Wednesday did something especially important:
It began filling Monday's bullish imbalance.
Remember the bullish daily FVG: $762.00–$772.57
Wednesday's low $766.50
Price had suddenly delivered deep into the gap.
This is why traders cannot assume that every strong gap or displacement candle will simply continue forever.
Imbalances often become future areas of interest.
Wednesday went looking for that unfinished business.
Thursday, September 24
The Gap Down That Buyers Refused to Accept
Open: $764.07 - High: $768.95 - Low: $763.25 - Close: $767.18
Thursday may have been the most educational candle of the week.
Wednesday closed at $767.81
Thursday opened at $764.07
That is a large downside opening gap of approximately $3.74
Price then dropped even farther to $763.25
That became the weekly low.
At that moment, SPY was sitting only:
$1.25 above the lower boundary of the bullish daily FVG.
In other words, the Monday-Tuesday imbalance had been almost completely worked through.
Then buyers responded.
SPY rallied all the way to $768.95
That move completely filled Thursday's opening gap.
And price closed at $767.18—only modestly below Wednesday's close.
This is why Thursday's raw percentage change of just -0.08% does not tell the whole story.
Intraday?
There was a huge battle.
The session began under heavy pressure amid rising oil prices, Treasury yields and geopolitical uncertainty, but U.S. stocks recovered sharply from the day's lows after reports that U.S. and Iranian negotiators were exploring a phased path toward de-escalation. Fidelity
Technically, Thursday was a bullish recovery candle after a gap-down flush.
And because Thursday's high remained beneath Tuesday's low, it simultaneously completed the three-day sequence that created our new:
Bearish Daily FVG: $768.95–$772.57
So by Thursday night, SPY had:
Nearly filled Monday's bullish FVG
Created a new bearish FVG above
Rejected the weekly low
Recovered the day's opening gap
That's a lot of structure in one candle.
Friday, September 25
Buyers Finish the Week Fighting Back
Open: $768.78 - High: $772.28 - Low: $766.29 - Close: $771.35
Friday opened $1.60 above Thursday's close.
But once again, the opening gap didn't survive.
Price fell to $766.29
which completely filled Friday's opening gap.
And then?
Buyers stepped back in.
SPY rallied to $772.28 and closed at $771.35
The candle produced:
A $2.57 bullish real body
A substantial $2.49 lower wick
A close in the upper portion of the daily range
That lower wick is worth noticing.
Friday did not simply trend straight up.
Sellers pushed.
Buyers answered.
AI-related optimism and hopes for progress in Middle East negotiations helped support stocks Friday, while easing oil prices improved sentiment. Fidelity
But the technical detail matters even more.
Friday's high of $772.28
traveled almost completely through Thursday's bearish FVG.
The top of that imbalance sits at $772.57
So SPY stopped just:
$0.29 short of completely filling it.
And that gives us one of our first levels for next week.
What the Entire Week Told Us
This week's chart was essentially a lesson in expansion, imbalance, mitigation and response.
Monday: Expansion higher.
Tuesday: Momentum stalls.
Wednesday: Price reverses into the bullish FVG.
Thursday: Bullish FVG nearly fills—and buyers respond.
Friday: Price recovers into the bearish FVG.
By the closing bell, SPY had worked through nearly every major imbalance created during the week.
But not quite.
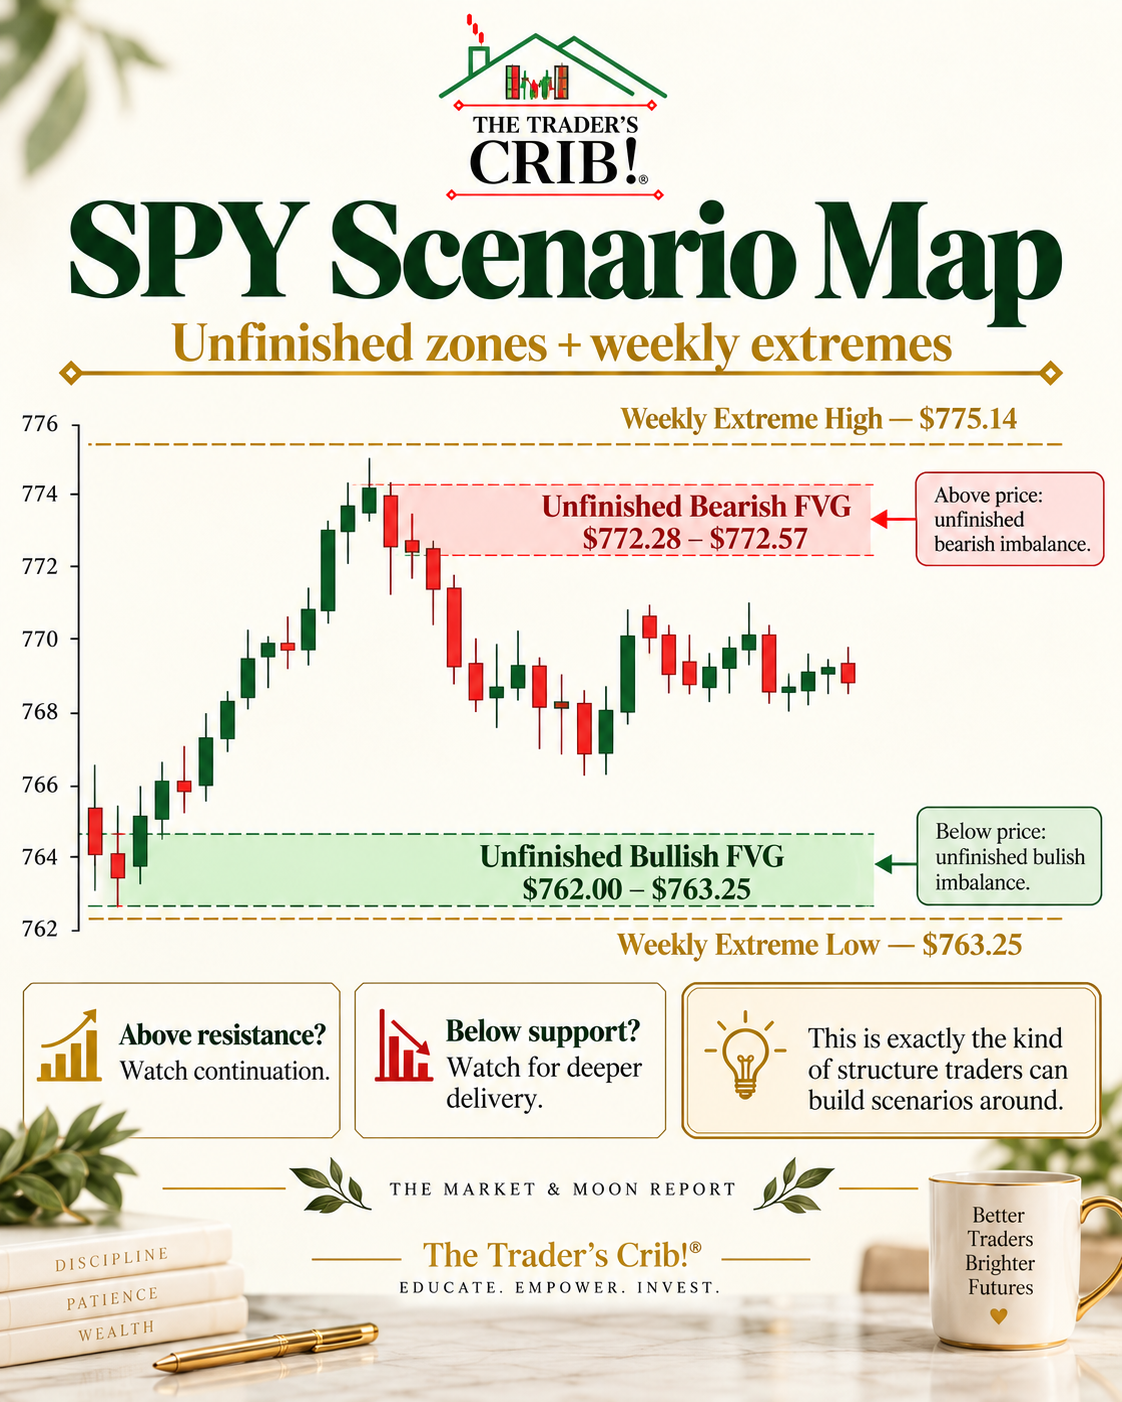
Below: $762.00–$763.25 remains unfinished from the bullish FVG.
Above: $772.28–$772.57 remains unfinished from the bearish FVG.
And beyond those immediate zones?
We have the week's major extremes:
$775.14 above.
$763.25 below.
This is exactly the kind of structure traders can build scenarios around.
SPY Outlook: September 28–October 2, 2026
The coming week also contains potentially significant macro catalysts.
Personal Consumption Expenditures inflation data is scheduled for Wednesday, September 30 at 8:30 AM ET, while the September Employment Situation is scheduled for Friday, October 2 at 8:30 AM ET. Those reports could materially affect Treasury yields and expectations for the Federal Reserve's next move. Federal Reserve Bank of New York
So this may not be a week to become emotionally attached to a Sunday-night forecast.
Prepare both directions.
🟢 Bullish Perspective
For the bullish case, I first want to see SPY deal with the tiny remaining bearish imbalance overhead:
$772.28–$772.57
A move through $772.57 would fully mitigate that FVG.
From there $773.50 to Monday's close $775.14. Last week's high become the next meaningful references.
If SPY can establish acceptance above $775.14 the next larger resistance area sits around the August highs $778.80–$779.37
Those are significant recent swing highs from August 13–14. Yahoo Finance
And psychologically? $780 becomes impossible to ignore.
The bullish roadmap is therefore:
$772.57 → $775.14 → $778.80–$779.37 → $780
But remember:
A wick through resistance is not the same as acceptance.
We want to see price break, hold and build above the level.
🔴 Bearish Perspective
The bearish case begins if SPY repeatedly fails around:
$772.28–$775.14
and begins losing Friday's structure.
The first downside reference is $768.95 —the lower boundary of the bearish FVG.
Then $766.29 Friday's low. Below that, Thursday's structure becomes important $763.25
And this is where the chart becomes especially interesting.
The remaining bullish daily FVG sits $762.00–$763.25.
So if SPY returns to Thursday's low, it would be standing directly above the last unfinished portion of Monday's bullish displacement.
A break below $762.00 would completely fill both:
the bullish daily FVG
the remaining portion of Monday's traditional range gap
Below there, the prior week's $757–$758 region becomes relevant again.
The bearish roadmap:
$768.95 → $766.29 → $763.25 → $762.00 → $758 area
SPY Map
The simplest way to think about next week?
Above $772.57, buyers can start challenging the weekly high.
Above $775.14, the August highs come back into focus.
Below $766.29, the week's lower structure starts reopening.
At $763.25–$762.00, the market is dealing with unfinished daily imbalance.
🌙 The Moon Report

September 28–October 2, 2026
Now we move from market structure to mindset.
Saturday, September 26 brings the exact Full Moon at approximately 12:49 PM Eastern Time in New York.
The following trading week therefore takes place entirely during the waning half of the lunar cycle, with the Third Quarter arriving Saturday, October 3 at approximately 9:25 AM ET. Time and Date
Moon illumination decreases through the week—from roughly 95% Monday toward roughly 61% Friday. Metcheck.com
In Vedic terminology, we are moving through Krishna Paksha, the waning half of the lunar month.
At The Trader's Crib!®, we do not use this as a directional signal for stocks.
Instead, it gives us a useful reflection framework.
And the waning phase offers an especially powerful question for traders:
What can I remove?
Not add.
Remove.
One unnecessary indicator.
One impulsive setup.
One revenge trade.
One notification that keeps pulling you away from your plan.
One expectation that you have to catch every move.
For women balancing multiple areas of life, simplification can be a trading advantage.
Your attention is capital too.
This Week's Sidereal Moon Journey

The Moon moves from Aries into Taurus at approximately 3:44 AM Wednesday, then from Taurus into Gemini at approximately 6:10 AM Friday. Horalabs
Let's break down what that can mean for our mindset.

Monday, September 28
Waning Gibbous Moon in Aries♈ — Mesha
The sidereal Moon is in Aries, or Mesha, Monday. The Panchang begins with Krishna Dwitiya, transitioning into Tritiya shortly after the U.S. market opens, around 9:44 AM Eastern. Horalabs
Aries is traditionally ruled by Mars.
Its symbolism is:
Initiation
Courage
Independence
Action
Speed
After a Full Moon weekend, that can feel like:
“Let's go.”
But for a trader?
Fast energy is useful only when it has structure.
Energy of Focus: Intentional Action
Before the bell, decide:
What is my A+ setup today?
Not five setups.
One.
If you're checking futures while answering emails, getting children ready, preparing for work, running your business or managing twenty other things before 9:30, the solution is not necessarily more screen time.
It's clarity.
Mark:
Resistance.
Support.
Your invalidation.
Then step away until price comes to you.
Monday's mantra:
"I don't have to chase momentum to participate in opportunity."

Tuesday, September 29
Waning Gibbous Moon in Aries♈
Tuesday remains in sidereal Aries throughout the U.S. session. Krishna Tritiya transitions into Chaturthi at approximately 7:41 AM ET, before the opening bell. Horalabs
Aries energy continues.
But by Tuesday, there's a different risk:
Carrying Monday into Tuesday.
Maybe Monday was amazing.
Maybe Monday was terrible.
Neither should determine Tuesday's execution.
Energy of Focus: Emotional Separation
Women are often asked to switch rapidly between roles throughout the day.
Trader.
Business owner.
Employee.
Partner.
Mother.
Daughter.
Friend.
Student.
Leader.
The trading lesson? Every role does not belong inside the trade.
If something stressful happens before the opening bell, acknowledge it.
But ask yourself:
“Do I currently have the bandwidth to execute my strategy?”
That question is risk management too.
Tuesday's mantra:
"Today's trade does not owe me anything because of yesterday."

Wednesday, September 30
Waning Gibbous Moon in Taurus♉ — Vrishabha
The Moon enters sidereal Taurus before Wednesday's session and remains there throughout market hours. Wednesday is Krishna Panchami. Horalabs
Taurus is traditionally ruled by Venus.
Its themes include:
Stability
Value
Patience
Security
Sensory grounding
Sustainability
And Wednesday happens to be an important macro day.
PCE inflation data is scheduled for 8:30 AM ET, one hour before the market opens. Federal Reserve Bank of New York
So we could easily see information, futures movement and opinions flying around before breakfast.
Energy of Focus: Ground Before You React
Taurus reminds us that stability is a strategy.
If futures move dramatically at 8:30?
You do not have to immediately formulate a trade.
If social media becomes convinced SPY is going to the moon—or crashing?
You do not have to join the conversation.
Allow the market to open.
Allow liquidity to establish.
Allow the first emotional reaction to happen without you.
Wednesday's mantra:
"I can wait until the market shows me where value is."

Thursday, October 1
Waning Gibbous Moon in Taurus♉
Thursday keeps the Moon in Taurus for the entire regular trading session.
The Panchang places the day in Krishna Shashthi, with the Moon remaining in Taurus until early Friday morning. Horalabs
This is where Taurus symbolism becomes especially helpful.
Energy of Focus: Consistency Over Excitement
Trading can become seductive when everyday feels like it needs to produce something.
Profit.
Content.
A screenshot.
A winning trade.
Proof that we're progressing.
But steady traders do not need every day to be dramatic.
Your greatest win on Thursday may be:
Following your stop
Taking one trade instead of four
Closing the platform when your setup isn't present
Protecting Wednesday's gains
Recognizing fatigue before it becomes expensive
If you're already mentally carrying everything else in your life, you do not need your trading process adding chaos.
Let it be the structured part.
Thursday's mantra:
"Boring execution can build extraordinary consistency."

Friday, October 2
Waning Gibbous Moon in Gemini♊ — Mithuna
The Moon enters sidereal Gemini at approximately 6:10 AM Eastern, before the U.S. market opens. Friday is Krishna Saptami. Horalabs
Gemini is traditionally ruled by Mercury.
Its themes include:
Information
Communication
Adaptability
Curiosity
Mental movement
And Friday gives us a perfect real-world example of how that symbolism can be used constructively.
**The September U.S. employment report is scheduled for: 8:30 AM ET Friday before the market opens. Department of Labor
There may be headlines.
Numbers.
Revisions.
Bond moves.
Futures reactions.
Analysts interpreting the report twelve different ways.
That is exactly where Gemini's strength can become its weakness.
More information does not automatically mean better decisions.
Energy of Focus: Filter the Noise
Write two scenarios before the data.
If price accepts above resistance…
I know what I'm watching.
If price loses support…
I know what I'm watching.
Then let price tell you which scenario is active.
You do not need fifteen tabs open.
You do not need six people on YouTube telling you what payrolls mean.
You need:
Price.
Levels.
Risk.
Friday's mantra:
"Information is useful. Overload is not."
The Moon's Trading-Week Rhythm
The exact Third Quarter follows on Saturday, October 3 at approximately 9:25 AM ET. Time and Date
Where the Market and Moon Meet This Week
There is a beautiful symbolic parallel in this week's setup.
Last week, SPY created excess.
Then it started filling it.
A bullish imbalance formed.
Price went back into it.
A bearish imbalance formed.
Price went back into that too.
And now the Moon itself is waning.
Again, we're not saying the Moon caused the market's behavior.
We're using the symbolism as a mindset prompt.
The theme is: Clear what is unnecessary.
In the chart: Unfinished imbalance.
In your trading: Unfinished habits.
Maybe this is the week you stop moving your stop.
Maybe you stop entering before confirmation.
Maybe you stop taking trades simply because you have time available.
Maybe you stop assuming being busy means being productive.
Maybe you stop carrying a losing morning into your afternoon.
There is power in subtraction.
The Trader's Crib!® Weekly Takeaway

Last week showed us exactly why trading requires flexibility.
Monday looked powerfully bullish.
Tuesday looked uncertain.
Wednesday reversed.
Thursday flushed lower and recovered.
Friday rallied again.
If you had decided Monday morning that SPY was “definitely bullish all week,” Wednesday probably hurt.
If you decided Wednesday that the rally was “over,” Thursday and Friday challenged that idea too.
Price does not owe us consistency. Our process does!
We enter the new week with SPY at $771.35
And the closest unfinished business sits on both sides.
Above:
$772.28–$772.57
$775.14
$778.80–$779.37
Below:
$768.95
$766.29
$763.25–$762.00
That's enough!!
We do not need forty levels.
We do not need to know Monday morning where SPY will finish Friday afternoon.
We need to know:
Where is price?
What is it confirming?
Where am I wrong?
How much am I willing to risk?
And for the woman trading while also carrying the rest of her life?
Remember this:
You do not have to become a different version of yourself to become disciplined.
You do not have to ignore your responsibilities.
You do not have to sit in front of six monitors all day.
You do not have to catch every move.
Build a process that fits your real life.
Protect your attention the same way you protect your account.
Let alerts work for you.
Let levels work for you.
Let “no trade” remain a valid decision.
And as this Moon begins to wane:
Release the need to force it.
Release the need to prove it.
Release the need to trade every opportunity.
"Trade the setup that belongs to you.
Then let the rest go."

Educate. Empower. Invest.
— The Trader's Crib!®
The Market & Moon Report is provided for educational and informational purposes only and does not constitute financial, investment, legal or tax advice. Fair value gaps, candlestick patterns, support/resistance and other technical-analysis tools do not guarantee future price behavior. The Vedic Astrology portion reflects traditional symbolic interpretations and is presented as a mindset and reflection framework; astrology has not been scientifically established as a reliable predictor of securities prices or financial-market direction.
