
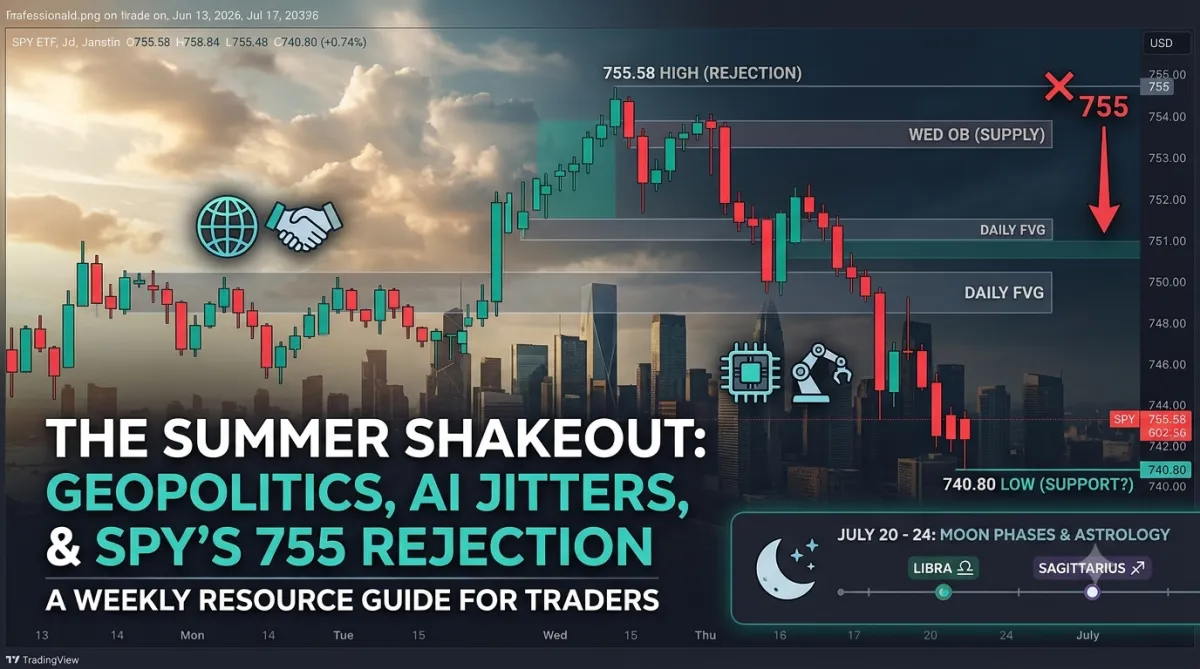
The Summer Shakeout: Geopolitics, AI Jitters, and SPY’s 755 Rejection
Your definitive weekly guide to SPY price action, key levels, and market astrology.
Weekly Overview: July 13 – July 17, 2026
Last week, the SPDR S&P 500 ETF (SPY) delivered a masterclass in market structure and liquidity sweeps. After pushing into a major supply zone early in the week, the market faced a barrage of geopolitical tensions in the Middle East and renewed artificial intelligence valuation worries. The result? A brutal rejection from the 755 highs, capping off the week with a strong bearish engulfing weekly candle.
Here is how the action unfolded day by day, complete with critical order blocks and Fair Value Gaps (FVGs) to help you map your charts.
Day-by-Day Technical Breakdown
Monday, July 13
Open:752.47 |High:753.91 |Low:748.00 |Close:749.17
Price Action:The week kicked off with a cautious tone. SPY attempted an early morning push into 753.91 but immediately found heavy resistance. Sellers stepped in, driving the price down to sweep sell-side liquidity at the 748.00 level. The day closed bearishly, leaving a clear line in the sand for buyers to defend.
Tuesday, July 14
Open:750.91 |High:753.34 |Low:748.66 |Close:751.83
Price Action:Tuesday saw a classic liquidity grab. Price dipped early to test the waters at 748.66, tapping into a bullish order block established from the previous week's consolidation. Once the weak hands were shaken out, buyers aggressively reclaimed the tape. The market rallied into the close, forming a bullish hammer on the daily chart.
Wednesday, July 15
Open:754.24 |High:755.58 |Low:750.20 |Close:754.81
Price Action:Bulls took control right out of the gate, gapping up and pressing into the critical 755.65–760 supply zone. SPY topped out at the week's absolute high of 755.58. However, the momentum stalled. Instead of a breakout, price consolidated tightly near the highs, ultimately closing slightly lower than the open. This hesitation at a major weekly order block was the first warning sign of exhaustion.
Thursday, July 16
Open:752.76 |High:754.57 |Low:747.88 |Close:750.72
Price Action:The market character shifted dramatically. After a failed morning retest of 754.57, sellers took the wheel. A sharp downside move breached the 750 psychological level, leaving a daily Fair Value Gap (FVG) in its wake. The 750.72 close signaled a confirmed bearish reversal, heavily influenced by news of chipmaker capex concerns and competitive AI models.
Friday, July 17
Open:742.08 |High:747.29 |Low:740.80 |Close:743.29
Price Action:Bearish momentum accelerated with a massive gap down to 742.08. A brief morning relief rally attempted to fill the gap and rebalance the chart, reaching 747.29. However, this was purely a liquidity grab. The tape aggressively sold off to the week’s absolute low of 740.80 before settling at 743.29. The weekly candle finalized as a massive bearish engulfing bar, locking in a -1.24% loss for the day.

The Week Ahead: SPY Price Prediction (July 20 – 24)
The violent rejection from 755 and Friday’s unclosed gap down suggest the path of least resistance is currently down. For the upcoming week, all eyes are on the740 liquidity pool.
Bearish Scenario:If sellers decisively break and hold below 740, expect a rapid descent to test the next major daily order blocks around 735 and 730.
Bullish Scenario:If buyers can form a base and defend 740, look for a relief rally to test Friday's supply zone. The primary upside target will be filling the FVG between 747 and 750.
Given the current geopolitical climate and tech sector sensitivity, traders should wait for clear confirmation of market structure shifts on the 15-minute charts before committing to heavy sizing.

Market Astrology: Moon Phases & Daily Energy (July 20 – 24)
For traders who incorporate cosmic cycles into their psychological preparation, this week offers a major energetic shift. Mercury retrograde finally comes to an end, clearing the fog around communication and decision-making.
Here is the astrological energy breakdown for the upcoming trading days:
Monday, July 20 (Waxing Crescent):
Moon in Libra:The week begins with an emphasis on balance and partnerships.
Trading Energy:Cultivating new strategies. Focus on restoring equilibrium to your portfolio. Don't force trades today; instead, gather data and observe how the market digests last Friday's selloff.
Tuesday, July 21 (First Quarter Moon):
Trading Energy:Action and friction. The First Quarter moon often brings a sense of urgency or a hurdle to overcome. Expect potential intraday volatility as the market decides whether to break support or initiate a reversal. Stick to your risk management rules.
Wednesday, July 22 (Waxing Gibbous):
Sun enters Leo:A fiery, confident energy enters the atmosphere.
Trading Energy:Boldness and leadership. If a clear setup presents itself, this is the day to execute with conviction. Trust your analysis and don't second-guess your pre-market plans.
Thursday, July 23 (Waxing Gibbous):
Moon in Sagittarius:The Leo Sun aspects the Sagittarius Moon, providing a massive boost of optimism and momentum. Furthermore, Mercury stations direct!
Trading Energy:Clarity and expansion. The mental haze lifts. This is an excellent day for identifying long-term swing trade entries, as market direction should become significantly clearer.
Friday, July 24 (Waxing Gibbous):
Trading Energy:Refinement and preparation. As the moon builds toward next week's Full Moon, focus on taking profits, adjusting stop-losses, and securing capital. Avoid entering impulsive trades right before the weekend close.
