
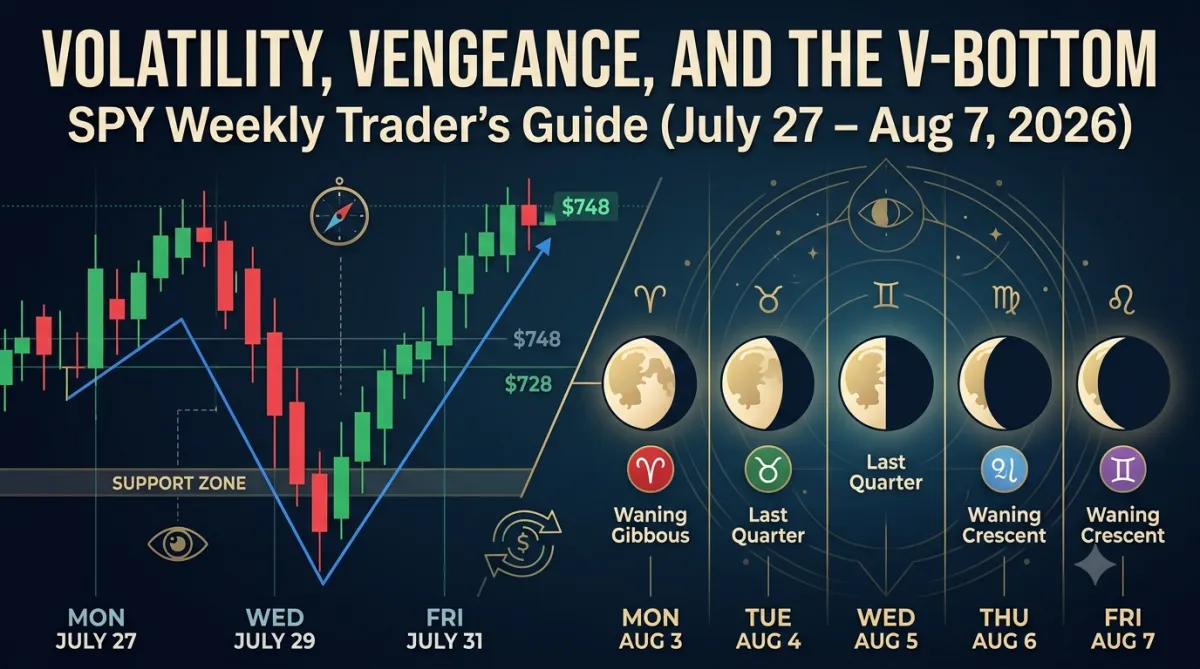
Volatility, Vengeance, and the V-Bottom: SPY Weekly Trader's Guide (July 27 – Aug 7, 2026)
Welcome to your weekly market blueprint. The final week of July brought aggressive volatility to the S&P 500 ETF (SPY) as a sharp mid-week selloff in technology and semiconductor stocks tested key structural demand before buyers stepped in with force.
Below is your breakdown of last week’s price action using Smart Money Concepts (SMC)—including Fair Value Gaps (FVGs), Order Blocks (OBs), and candlestick patterns—followed by our market outlook and lunar energy roadmap for the week of August 3–7, 2026.
SPY Price Action Review (July 27 – July 31, 2026)
Weekly Candlestick Structure
Weekly Range: High $748.88 | Low $728.10 | Close $747.03
Structure: The weekly candle printed a classic Pin-Bar / Hammer with a deep lower wick, reflecting strong rejection of sub-$730 levels and a full recovery back into the upper range.

Day-by-Day Technical Breakdown
Monday, July 27, 2026: Bearish Expansion
OHLC: Open $744.91 | High $745.53 | Low $735.87 | Close $739.09
Candlestick Pattern: Large Bearish Marubozu / Expansion Candle.
SMC Setup: Price swept sell-side liquidity below the $742 level, tapping directly into a Daily Bullish Order Block ($736.00 – $739.00). Left an overhead Bearish FVG ($742.50 – $744.80).
Tuesday, July 28, 2026: Consolidation & Retest
OHLC: Open $738.85 | High $741.69 | Low $736.52 | Close $741.69
Candlestick Pattern: Spinning Top / Bullish Inverted Hammer.
SMC Setup: Price held the Monday demand zone, attempting to re-enter the 1-hour FVG above $741.00. Low volume indicated absorption rather than outright selling.
Wednesday, July 29, 2026: Semiconductor Panic & Liquidity Flush
OHLC: Open $742.04 | High $742.04 | Low $728.10 | Close $729.63
Candlestick Pattern: Shaved-head Bearish Breakdown.
SMC Setup: Chip sector weakness triggered an aggressive institutional liquidation leg. Price breached major swing lows to take out monthly sell-side liquidity down to $728.10, completely filling a multi-week inefficiency gap.
Thursday, July 30, 2026: The Demand Rejection
OHLC: Open $730.61 | High $742.04 | Low $732.90 | Close $742.04
Candlestick Pattern: Bullish Engulfing / Reversal Hammer.
SMC Setup: Following the liquidity sweep below $730, heavy institutional buying entered at the $728–$732 Demand Block. SPY surged back up, closing directly inside the previous day's gap and creating a new Bullish FVG ($734.00 – $738.00).
Friday, July 31, 2026: Buy-Side Continuation
OHLC: Open $744.73 | High $748.88 | Low $737.69 | Close $747.03
Candlestick Pattern: Strong Bullish Continuation.
SMC Setup: Friday defended the $738.00 daily OB and reclaimed the $745 pivot. The move targeted buy-side liquidity above earlier week highs, establishing a solid bullish base into month-end.
Weekly Prediction & Levels (August 3 – August 7, 2026)
Strategic Market Bias: Moderately Bullish (Targeting $750–$755)
The aggressive V-recovery off $728.10 indicates institutional re-accumulation. Having swept major liquidity and held key higher-timeframe demand, the path of least resistance points toward overhead targets.
Lunar Phases & Astrological Energy Roadmap

Aligning technical setups with broader cycle dynamics can provide a unique edge in managing trading mindset, discipline, and energy.
Day-by-Day Trading Astrology
Monday, August 3, 2026
Moon Phase: Waning Gibbous
Zodiac Sign: Aries (Trine Jupiter)
Energy of Focus: Decisive Execution & Impulse Control. Aries energy brings bold moves at the weekly open. Be mindful not to chase initial breakout moves—stick strictly to planned entries.
Tuesday, August 4, 2026
Moon Phase: Waning Gibbous
Zodiac Sign: Taurus
Energy of Focus: Grounding & Value Assessment. Taurus brings steadying energy after Monday's momentum. Excellent day for position building, risk auditing, and respecting key support levels.
Wednesday, August 5, 2026
Moon Phase: Waning Crescent
Zodiac Sign: Taurus
Energy of Focus: Patience & Discipline. Focus on capital protection. Avoid over-trading during mid-week consolidation as the market digests early-week moves.
Thursday, August 6, 2026
Moon Phase: Last Quarter Moon
Zodiac Sign: Taurus transitioning to Gemini
Energy of Focus: Strategy Audit & Purging Bad Habits. The Last Quarter phase is optimal for releasing underperforming trades, clearing emotional baggage, and adjusting trade sizing.
Friday, August 7, 2026
Moon Phase: Waning Crescent
Zodiac Sign: Gemini (Conjunct Uranus & Venus in Libra)
Energy of Focus: Breakthroughs & Adaptability. Gemini aligned with Uranus favors rapid information flow and potential breakout surprises. Stay nimble into the weekend close.
Trader's Checklist for the Week Ahead
Watch for a retest of the $738–$741 zone early in the week to look for long entries.
Manage profits near the $750 psychological level.
Keep position sizing aligned with the shifting lunar energy—aggressive early, defensive mid-week.
Disclaimer: This blog post is for educational and informational purposes only and does not constitute financial or investment advice. Always manage your risk according to your personal trading plan.
